Categories
Budgets Improving Bus Service Just Growth Just Growth Champions Measure M Public Participation Resources Social Equity transportation equity Transportation Finance Uncategorized

How We Got Here: Three Decades of Equity at Metro

When Metro merely mitigates for inequitable impacts of already formed projects, Metro sustains economic disparities to resources and opportunity throughout greater LA.

Today, Metro attempts to achieve equitable outcomes by minimizing disparate impacts on new projects. Metro projects routinely include mitigation measures to compensate for the parts of a project they see negatively impacts communities that Metro defines.

Metro’s attempts to compensate for inequitable (read: unfair) impacts per project might appease project concerns. However, this approach alone cannot counteract the scale to which enduring hardships weigh on people whose livelihoods rely on LA’s public transportation system.

Compensation plus systems change is needed to address inequity’s root cause. Discriminatory public policy like redlining starts with exclusionary thinking and abets discriminatory outcomes when applied to investments over time. Rather, Metro can achieve fair (read: equitable) outcomes by acknowledging the role its legacy has played in the past. In their Equity Platform Framework, Metro acknowledges that “historically and currently, inequity exists and has been largely defined by race and class – as well as age, gender, disability, and residency. Metro commits to working with historically underserved communities to establish meaningful equity goals.”

Once Metro’s choices reflect a trend of more equitable outcomes then Metro can more genuinely engage with the public to shape and fulfill initiatives that not only lower travel burdens but also transform underserved communities’ access to resources and opportunities. Metro’s 10-year strategic plan (Vision 2028), which the board adopted in 2018, further commits the agency to equitable outcomes. Here, the author of this article recaps Metro’s prior missteps and reviews the agency’s current attempts to more equitably serve LA’s residents and visitors than Metro has in the past.


How has Metro involved equity in the past?

Since April 1993, the state of California has authorized Metro to plan, fund, build, and operate LA County’s transportation system [1]. However, Metro has not always carried out its duties fairly. In fact, over the last three decades Metro has gone from being sued for overlooking its most vulnerable customers to now mitigating for inequitable outcomes of Metro initiatives. Next, Metro should prospectively apply equity to transform greater LA into a thriving region.

Below is a summarized timeline of how Metro has involved equity in the past.


I. Mandated compliance with Bus Riders Union/Metro consent decree


Long before Metro’s founding in 1993, LA transportation officials ambitiously sought to grow a rail transit system that effectively outshined their efforts to cultivate a robust and reliable bus network. In the early 1990s, LA County bus riders — who overrepresented LA County’s population of people of color — shouldered the burden of the regions’ investment in growing a rail network (arguably still the case today). For instance, in 1992, Metro’s buses “carried 94 percent of the agencies ridership, yet the agency dedicated less than a third of its annual budget to bus operations.” At the same time, an overwhelming majority of the agency’s budget (71 percent) went to budding rail programs “that served only 6 percent of Metro’s ridership” [1, p. 163].

While the total number of rail riders was limited by a scant rail network at the time (only Metro’s Blue line was open by 1992), transportation officials willingly decided to invest in rail transit to an extent that dwarfed their investment in bus transit. Rail transit generally costs transit agencies more than bus transit to build and operate because of the many expensive components of rail transit like installing steel tracks and electrical power systems. Although bus passengers in the early 1990s were crowding onto Metro’s buses, transportation officials failed to invest in ways that would directly alleviate overcrowded buses by buying more buses or by operating buses more frequently and reliably in dedicated bus lanes, for example. In spite of this paradigm, LA’s transportation officials in 1994 proceeded to propose a fare increase whose burden would fall heavily on Metro’s bus riders, while simultaneously spending on expensive rail expansion.

In 1994, the Bus Riders Union (an organized coalition of bus riders) and their attorneys from the NAACP’s Legal Defense Funds (LDF) successfully stopped Metro’s proposed fare hike. In 1996, U.S. District Court Judge Terry Hatter Jr. ruled that such a fare hike would result in “disparate impacts” to the Metro’s bus riders who were over 80 percent people of color. By comparison, people of color comprised of less than 60 percent of LA County’s population at the time [1]. Now popularly known as the ‘consent decree,’ this court order precipitated a cap on Metro’s transit fares for 10-years (which has since expired in 2006) and required Metro to buy more buses to alleviate overcrowding. Significantly, this intervention shifted Metro’s attention to address the needs of their current (mostly bus) riders who overwhelmingly represented low-income communities of color, which remains the case today.


II. Indirect attempts to apply equity in planning


In the first decade of the 2000s Metro remained the rail, bus, and highway agency it had already been for more than three decades. Metro’s 30-year (long-range) transportation planning (LRTP) document from 2009 reflects transportation officials’ continued rail building ambition. It also shows how relatively little investment and attention Metro pays to enhance walking and biking infrastructure, which enable basic human-powered mobility. Metro’s 2009 plan dedicates a mere one percent of the agency’s planned investments over 30 years to improve biking and walking linkages to transit (see 2009 LRTP, Figure F) — outspent twice over by ‘Administration and Other’ costs and thirteen times over by ‘Street and Road’ costs, which until recently have been designed with a singular focus: how to make it easier to drive a private automobile.


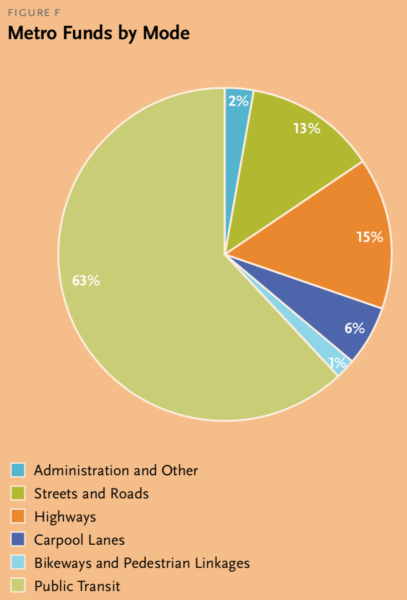
Source: Metro’s 2009 Long Range Transportation Plan, p. 15


The 2009 LRTP does not address nor ameliorate mobility disparities based on race and income. Although the 2009 plan includes a ‘job accessibility’ metric to show mobility disparities, Metro fails to address the implications of these disparaging metrics. The 2009 plan accepts weak outcomes like taking three decades to achieve small gains. For example, Figure 11 of the 2009 plan (copied below) shows that Metro will take 30 years to lower transit commute times to under an hour for a small additional (12 percentage point) share of transit dependent neighborhoods, which have mostly carless, low-income, or senior households. The 2009 plan ignores the remaining 41 percent of work trips from transit dependent neighborhoods that will take more than an hour by transit for, at least, another 30 years.


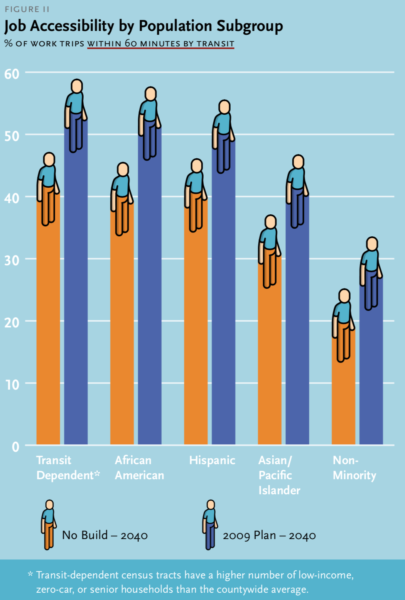
Source: Metro’s 2009 Long Range Transportation Plan, p. 54 (red underline added for emphasis)


Secondly, the same ‘Environmental Justice’ section of the 2009 plan overstates the positive impact the 2009-plan proposed projects could have on communities of color. For at least 30 more years (through 2040), around half of LA County’s African American, Hispanic, and Asian American ‘subgroups’ and around 70 percent of ‘non-Minority subgroups’ will remain over an hour away from work by transit — an outcome that reflects the need for transportation officials to focus more meaningfully on changing their relationship with policies that govern housing and job growth, which underlie people’s need to travel. Finally this 30-year plan focuses heavily on work trips largely sustaining difficulty for people whose access and independence relies on transit.


III. Broadening the agency’s engagement with local officials and advocates


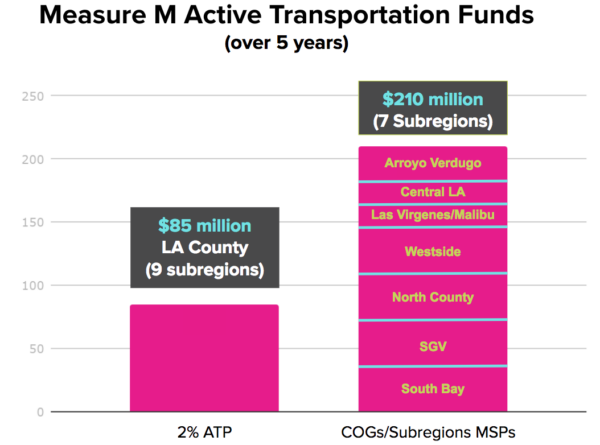
In the current decade, Metro accounted for city-controlled infrastructure by committing Measure M funds to cities through two programs: the ‘Multiyear Subregional Program’ (MSP) and continuing the ‘Local Return’ program. Metro also lowers cities’ costs of applying for state transportation funds by assigning Metro staff to write grant proposals for cities. Metro offers this service, called Technical Assistance, to cities free-of-charge.

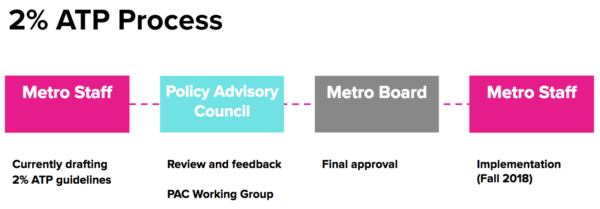
In the years leading up to 2016, Metro officials built a broad-based coalition that included local officials and advocates to campaign for a sales tax measure, which officials expect will raise $120 billion over 40 years for transportation purposes. Subsequently, Metro’s CEO convened a Policy Advisory Council to help develop the 2020-50 Long Range Transportation Plan “and other work plans and policy areas that the Metro Board may request.” When the measure passed, coalition members representing local jurisdictions, consumers, and other transportation providers gained seats on the Metro Policy Advisory Council (PAC). Members of the PAC’s ‘consumers’ constituency group especially advocate for social equity.

In 2018, Metro Board adopted a 10-year strategic plan (Vision 2028), which validates equity’s importance to fulfilling Metro’s mission. In the plan Metro commits to prioritize communities with need, but stops short of designating who in the agency would guide and how they would hold the agency accountable to its equity commitment. At a public meeting in February, Metro CEO Phil Washington alluded to hiring an officer to champion equity for Metro. We support this notion and urge Metro to hire a CERO – Chief Equity & Race Officer – with multiple staff to define equity and set performance measures, which reinforces all four pillars of the Equity Platform Framework and helps fulfill Vision 2028 strategic goals.

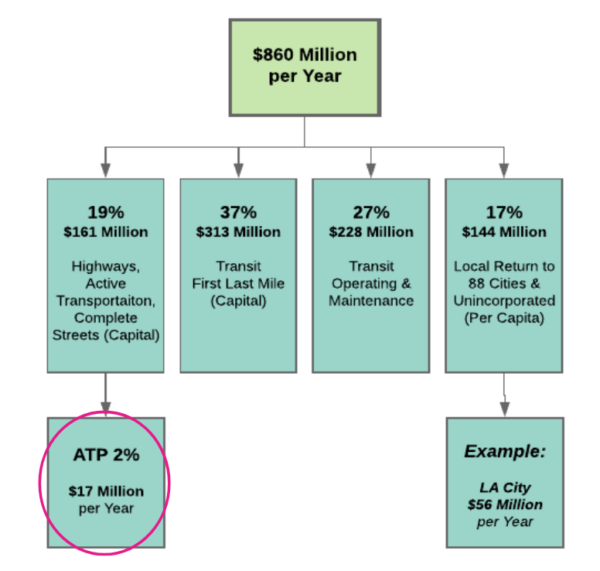
Also in 2018, Metro directors promised to prioritize investments to communities based on need by adopting the Equity Platform Framework. With the framework, Metro challenges its staff to approach every decision with the goal of achieving equitable outcomes countywide. Immediately, the framework should impact how Metro redesigns Metro’s bus network (NextGen), develops a 2020-50 Long Range Transportation Plan, deliberates which projects to accelerate, designs a congestion pricing program, and distributes Measure M’s Active Transportation Funds.


What’s next? Centering equity at the outset of every initiative

In the next decade, Metro must move equitable decision-making from the margins to the center of all of its work. When Metro’s directors recently approved their initiative to “Reimagine LA County,” they reaffirmed their commitment to achieve equitable and sustainable outcomes through mobility. Later this month, Metro’s directors will have a chance to anchor equity in Metro’s congestion pricing and TNC fee studies at the outset.

Categories
Improving Bus Service Just Growth Measure M transportation equity Transportation Finance Uncategorized

Measure Thrice, Cut Once: The Moral Imperative of Getting Congestion Pricing Done Right in LA

When Measure M was on the ballot almost three years ago, voters were told that its passage would help ease congestion in traffic-choked Los Angeles. Since its passage we’ve seen the unprecedented rail construction across the region, but still the average LA driver spends 100 hours stuck in traffic every year. What are some other solutions?

Congestion pricing is one traffic management tool. It uses price to incentivize would-be drivers to travel differently at busy times of day by charging actual drivers a fee for using certain routes. Just as gasoline prices go up before long weekends to prevent a gasoline shortage, traffic congestion prices would fluctuate to address high-demand — in this case, vehicle demand for road space. Case studies show that in addition to alleviating traffic, congestion pricing reduces greenhouse gas emissions and traffic crashes — a trifecta of important benefits for LA County.

Last December, LA Metro’s chief executive officer, Phil Washington, and his staff  introduced the LA Metro Board to congestion pricing as a potential way to fill a $26 billion funding gap to complete a suite of 28 LA Metro projects that the LA Metro Board seeks to finish before the 2028 Olympics and Paralympic Games in LA. Last month, Mr. Washington and the LA Metro Board took a different approach and focused on the concept of charging drivers as one possible and very bold way to get rid of vehicle congestion in LA and possibly even fund free transit. Yet details on how that would happen are still being discussed.


Congestion pricing in LA today

Metro already operates high-occupancy toll (HOT) lanes or “ExpressLanes” on portions of the I-10 and I-110 freeways. Solo drivers can choose to pay a price to bypass drivers in the toll free/regular freeway lanes by instead driving in the designated ExpressLanes where operators guarantee a desired average travel speed set by LA Metro. Carpoolers that fulfill the minimum occupancy requirements (2 or more persons) may drive in HOT lanes toll free. Some of the most reliable public buses in LA also operate in the HOT lanes, such as the Silver Line which runs on-time around 90 percent of the time.

Metro offers low-income drivers a one-time subsidy when enrolling in the ExpressLane program, if applicants are able to prove their eligibility. Metro also seeks to mitigate the health burden imposed on low-income communities situated next to freeways by committing proceeds of toll revenue to city active transportation and transit projects serving communities within three miles of the toll lanes. This last point is an important component to a successful congestion pricing model: investing in accessible and reliable transportation choices for people to get around without driving their car.


Congestion pricing models

Below are three models of congestion pricing that Metro is currently studying for feasibility.

Cordon pricing — Drivers pay program operators a fee to drive into a designated area. Cordon pricing programs exist today in Singapore, London, and Stockholm. Cordon pricing models work when lots of drivers routinely enter a centralized (business) district with many transportation alternatives to driving. For instance, the Bay Area bridge tolls are a form of cordon pricing to enter San Francisco from other cities. Because jobs in LA are concentrated in numerous districts across the county, a cordon pricing model could be less appropriate in LA than other models. Downtown LA is the only jobs-rich area with many viable transit alternatives to driving. LA Metro estimates a cordon pricing program centered on downtown LA could generate up to $1.2 billion per year in revenue.

Source: Transport for London


Corridor pricing — Drivers pay program operators a fee to drive at a steady speed in any lane on a priced road corridor. LA ExpressLanes are a miniature version of a corridor pricing program. As with ExpressLanes, fees would be distance-based and time-based: digital signs present drivers with a cost to the next major exit when entering the facility (calculated behind the scenes by cost per mile) and electronically charge drivers once they pass sensors as they exit the facility. Because many road corridors become congested all over LA, a corridor pricing model, if implemented correctly, could present people in LA with impactful health and safety, among other, benefits. As the Metro research paper on this topic suggests, appropriate test corridors in LA could include portions of the I-101 freeway where it parallels the Metro Red Line and I-10 freeway where it parallels the Metro Expo Line. Agencies have not yet released revenue estimates for the corridor pricing model because too many variables remain undefined at this point in time.

Source: All Singapore Stuff


Vehicle miles traveled (VMT) pricing — Drivers pay road operators a fee to drive in excess of drivers’ allotted share of vehicle miles traveled. Agencies in California, Oregon, and Iowa have tested this model of pricing. Oregon’s test calculated the number of miles driven in a “congestion zone.” Although technology exists to implement this kind of pricing model, the model has not yet been implemented because of political challenges (Metro research paper). Because this model charges motorists according to miles driven independent of geography this model holds the greatest potential for alleviating traffic over a larger area. However, this model must thoughtfully consider land use and housing patterns in the region, as Los Angeles is increasingly seeing its more affordable places to live moving further away from job-rich areas. Revenue estimates for a region bigger than but principally including LA County reach as high as $10.35 billion per year. For comparison, Metro estimates Measure M generates $860 million in revenue per year.


What could congestion pricing accomplish?

Less traffic — Principally, the goal of congestion pricing is to alleviate chronic traffic on priced roads. As Metro’s congestion pricing primer paper states, traffic reduced by 20 percent in Singapore and 30 percent in London. In Stockholm, traffic reduced to 22 percent (down from 30-50 percent). As shown in LA Metro’s latest ExpressLanes performance report, drivers in LA’s ExpressLanes and bus riders who rode on the Metro’s Silver Line in the ExpressLanes traveled at speeds above LA Metro’s desired monthly average speed of 45 miles per hour.

Reduce air pollution — In addition to breaking-up vehicle congestion, congestion pricing could eliminate “elastic” vehicle trips that could be replaced by some other mode of travel. This lowers the total number of vehicle miles traveled, which reduces greenhouse gas emissions overall — a win for our planet and California’s legislative goals, to say the least. Over time, overwhelming driving (and parking) costs could incentivize widespread healthy, sustainable, and affordable living that seldomly requires car travel and hardly justifies car ownership.

Diminish disparities — Congestion pricing quickly and annually raises such large amounts of money that the revenue collected could transform how public agencies, including LA Metro, invest in transportation. When public agencies spend toll revenue in smart and equitable ways — by first spending on ways that improve transportation options in historically disinvested communities, people in the LA region as a whole enjoy more and higher-quality access to jobs, services, and life-enhancing opportunities. Public revenue raised by congestion pricing could be used to counteract decades of institutional neglect of vulnerable communities. At LA Metro, congestion pricing revenue could be used to do more than ask current staff to develop equity-informed recommendations to Metro Board. With Metro’s allocation of revenue raised by congestion pricing, Metro could hire equity-focused staff to teach and enforce equitable decision-making agency wide.


Criticisms

But to keep LA moving, we need viable and reliable alternatives to driving

True — successful implementation of any congestion pricing program requires prior and/or simultaneous implementation of viable transportation alternatives to driving alone. Congestion pricing models complement LA’s ongoing sales tax-funded initiatives. Congestion pricing models influence travelers demand for driving and its alternatives, including public transit. Meanwhile, LA’s sales tax-funded initiatives increase the supply of public transit service. Since over seven in ten people in Southern California “ride transit rarely or never, if one out of every four of those people replaced a single driving trip with a transit trip once every two weeks, annual ridership would grow by 96 million — more than compensating for the losses of recent years” (Manville, Taylor, and Blumenberg, 2018).


But would pricing roads divert traffic to other streets

Congestion pricing would serve as the incentive (on priced roads), while travel time on unpriced streets would simultaneously serve as the incentive (on unpriced roads) for drivers to travel differently. Drivers who might avoid priced roads by diverting onto unpriced roads might face long drive times that would themselves serve as an incentive to consider traveling differently.


But congestion pricing adds to the financial burden on low-income drivers

True — congestion pricing would add to drivers’ financial burden only if congestion pricing operators do not implement countermeasures to subsidize low-income drivers’ access to priced roads. Congestion pricing subsidies would extend (to low-income people who drive) a moral minimum mobility benefit that American society currently denies low-income people by not subsidizing their gasoline taxes or any of the (at least 9) other regressive ways we pay for transportation. Utility companies such as LADWP make sure people can access utilities regardless of income with lifeline services that subsidize low-income households’ access to water and electrical power, for example. Research shows that automobile access is as essential as utilities are to sustaining a lifestyle that can overcome economic disparities. The vast majority of drivers who need to drive and have means to pay congestion prices can instead help to achieve equitable outcomes with congestion pricing.


Congestion pricing, again, is only one tool in the traffic management toolkit. Using money as an incentive to change behavior requires thought and intention. Charging a toll to drive poses a choice on the traveler per trip. But behavior can only change without penalty if viable alternatives exist. Congestion pricing is effective when travelers can access and afford (in both time and money) to take transit, ride a bike or scooter, carpool, walk, or something else. We support thoughtful and intentional traffic management tools that do not impose additional burdens onto people who already have the fewest transportation choices.


Next steps

Get involved  LA Metro Board members will deliberate whether to commission a 2-year study on implementing a congestion pricing pilot someplace in LA County at the following 3 board meetings. These public hearings will take place in the Metro Board Room at One Gateway Plaza, Los Angeles, CA 90012, 3rd Floor at the following times.

Categories
Completing Streets Measure M Transportation Finance Uncategorized

What’s happening with funding for sidewalks, crosswalks, vision zero and more from Measure M?

Background: A key task of Metro’s Policy Advisory Council (PAC), established in early 2017, was to review, comment and provide input on the Draft Measure M Master Guidelines. And from the June 2017 adopted Measure M Guidelines came a commitment to develop the implementation procedures for ten key Measure M funding pots – eight of which the PAC was to review, comment and provide input (see Measure M Guidelines Administrative Procedures Commitments chart here). The remaining Measure M administrative procedures still to be developed with the PAC are:
– Transit Multi‐Year Subregional Programs
– Subregional Equity Program
– Metro 2% Active Transportation
– 2% System Connectivity Projects (Highway Construction Subfund)
– 2% System Connectivity Projects (Transit Construction Subfund)
– Countywide Bus Rapid Transit Expansion
This blog post is focused on Metro 2% Active Transportation – estimated to invest over $85 million dollars in the next five years in walking, rolling and bicycling investments. And it is important to note that a large majority of Measure M funding for Active Transportation is administered by the COGs in the Multiyear Subregional Programs.
—————————————————————————————————————————–

Developing the first regional fund for active transportation is no easy feat. Per Metro data, 87 percent of Metro Bus and 64 percent of Metro Rail customers arrive at their station or stop by walking, biking, or rolling. And so the Metro 2% Active Transportation Program (ATP) fund that could potentially be used for sidewalks, crosswalks, and Vision Zero is especially important. A strategic vision is essential to address these needs and leverage this new and critical regional funding (luckily Metro the Active Transportation Strategic Plan adopted in 2016!).

Metro’s last Policy Advisory Council (PAC) active transportation working group left many questions regarding how Metro currently funds our active transportation investments. It is important to note that before Measure M, less than 1% of all funding through Metro went to sidewalks, crosswalks, safe routes to school, bicycle lanes and other active transportation programs. Measure M funds are available to grow this long-needed investment across the region, ensuring our transportation system is accessible, safe, and dignified when people catch the bus and/or train. We want to know how the PAC can support a deliberate and equitable investment strategy.

Metro staff has now conducted two 2% ATP PAC work groups (April and July), presented multiple updates to the full PAC (March, May, and June), and shared how Measure M ATP 2% has been budgeted to date. It is Metro’s fiduciary responsibility to move investments forward, but we want to see these budgetary decisions clearly aligned with existing Metro policies (such as the Active Transportation Strategic Plan). We believe this will contribute to a more deliberate and meaningful investment strategy that will yield better transportation options for all.

In an effort to increase transparency and allow stakeholders to weigh in, CEO authorization of 2% ATP has been extended from its original timeline of June 2018 to later this Fall. This gives Metro and engaged stakeholders more time to address outstanding questions from PAC work group and full meetings:

Remaining PAC Working Group Key Questions

  • What qualifies as a “regional priority?”
  • How is funding being prioritized? How does Metro’s Equity Framework inform this program funding prioritization?
  • What are the opportunities for Board staff/non-PAC members to weigh in on the ATP 2% guidelines?
  • Metro Bike Share
    • What is the total cost of Metro Bike Share Program?
    • How has Metro Bike Share been funded in the past?
    • If funding from Metro Bike Share is removed from Measure M ATP funding (OMB has $23 million going towards it in the next 5 years in their cash flow recommendations) what other funding can be leveraged to keep Metro’s Bike Share Program fully funded?
  • Metro Bicycle and Pedestrian Programs
    • What specific programs does this program include?
    • How was it being paid for before?

Per Metro staff, they are still working on the following:

  • How do allocations to projects/programs within the subfund get made (decision making process and transparency)?
  • What are the specific eligibility requirements (especially related to capital/operations/programming)?

Metro staff set a goal to schedule an August 2% ATP PAC work group meeting to draft Measure M ATP 2% guidelines, which will then be presented at the September 11th Metro full PAC meeting. The Metro PAC will then have 30 days to review, comment and provide input.

In the meantime, we’d like to be proactive and have conversations with partners about what equitable and feasible guidelines they want to see for this fund. We invite interested folks to join our #JustGrowth conference call on August 28 at 11:30a to share their thoughts on how to best invest Measure M funding for first/last mile improvements, sidewalks, crosswalks, Vision Zero, and even Metro bus service, including dedicated bus lanes. To join the call or to learn more about getting involved, email me: amanda@investinginplace.org

Categories
Improving Bus Service Measure M transportation equity Uncategorized

Since 2013, Metro’s average bus speed has declined by 15%. It is time for the LA Region to get serious about bus lanes.

Metro is underway in their NextGen Bus Study to propose a redesign of the entire Los Angeles County Bus Network. NextGen marks the first time in 25 years that Metro will comprehensively re-examine the service it provides, even down to fundamentally rethinking what public transportation can and should be in the 21st century. It is expected the findings from this study will lead to launching a new bus network in the Fall of 2019.

While technology does provide opportunities for the transit sector to better tailor the experience of riding public transportation to the changing expectations of an increasingly-connected world, one thing that hasn’t changed in 2018 is that the quality of bus service will determine how people feel about going Metro.

Over the past 5 years, that quality has been trending downward. Since 2013, Metro’s average bus speed has declined by 15%. Meanwhile, today, rapid buses, originally envisioned as a stepping stone to Bus Rapid Transit, are on time just 66% of the time. As might be expected, average daily boardings have also fallen over the same period, as passengers seek faster and more reliable rides. The bus network carries 20% fewer riders today than it did in 2014.

Achieving NextGen’s goal of reinvigorating Metro’s ridership will require going beyond cosmetic measures like redesigning individual bus lines and marginal adjustments to frequencies. Metro needs to show riders that buses can be trusted to get them where they’re going in a reasonable amount of time. Given where the starting point is – a Metro presentation this month announced that nearly 80% of bus trips originating in the downtown area took at least twice as long as the same trip by car – any substantial solution must find a way to incorporate bus-only lanes on a greater number of LA’s streets.

Bus-only lanes are not a new concept in LA. The original El Monte Busway along the 10 freeway opened in the 1970s. But since then finding the political will to build and maintain high-quality bus lanes has been a halting process. Metro doesn’t have authority over what happens on city streets. The layout of the county, with its many interwoven municipalities, makes coordinating bus lanes along lengthy corridors a daunting challenge.

Take the example of Wilshire, for example. LA’s iconic thoroughfare from downtown Los Angeles to Santa Monica hosts the region’s busiest bus lines, and, on part of its length, it also has bus-only lanes. But the effectiveness of those lanes has been hindered by the refusal of specific cities and neighborhoods to allow transit-only lanes in their communities.

The lanes stop abruptly in Beverly Hills, Westwood, and Santa Monica, leaving buses stuck in some of the county’s worst traffic, and potentially wiping out the increased speed that they could be achieving by traveling in dedicated lanes. As one of the county’s largest distributors of tax revenue, Metro needs to be willing to use the substantial leverage it has at its disposal to encourage cities to accept bus-only lanes.

Design also plays a major role in the success of a bus-only lane. Using Wilshire again as an example, buses occupy the rightmost traffic lane, leading to frequent conflicts with backed up lines of cars turning right. In general, bus-only lanes should seek to separate buses from the movements of single occupancy vehicles as much as possible. On mixed traffic roads, that means giving buses the center lanes, allowing them to avoid delays. Having center-running bus lanes requires a greater commitment from Metro and the cities, as it necessitates providing some space for passengers to get on and off the bus safely on a platform in the center of the street. But this type of investment is what should be considered normal on LA’s most heavily traveled transit corridors – which are also the ones that experience the most significant traffic delay.

Design and corridor choice are only part of the battle for high-quality bus-only lanes. The continued effectiveness of these lanes relies on active management by Metro, largely boiling down to the enforcement that accompanies them. People driving single occupancy vehicles, as CEO Phil Washington noted on his way to a recent Dodgers game, can often be found in bus-only lanes, leading to traffic jams that negate the investment and scare riders away.

Transit-only lanes need to be clearly marked, and an expectation should be set that only authorized vehicles will be allowed to use the lanes. This type of enforcement, which focuses on improving the speed of a bus ride rather than on monitoring riders, should be a greater point of emphasis in Metro’s bus system.

Expanding bus lanes has never been an easy proposition. But the breadth of the responsibility that Los Angeles voters have placed in Metro’s hands, a sweeping mandate to expand transit use, reduce traffic, and improve the sustainability of our region, demands difficult action be taken. It is time for the LA Region to get serious about bus lanes.

Categories
COG Measure M Transportation Finance

The Road to Rolling and Walking in LA: A 2% Active Transportation Primer

You know what music is to the ears of active transportation advocates? Active transportation funding. Without dedicated funding, how can we build healthy communities where all people have safe and convenient transportation choices?


When Measure M was passed by voters in 2016, ensuring a $122 billion funding source for transportation investments across Greater Los Angeles, it marked the first countywide transportation sales-tax that specifically dedicated funding for active transportation!


But in a $122 billion expenditure plan that includes transit and highway construction, goods movement, transit operations, state of good repair (maintenance), and local return, where do we find the funds set aside for walking and rolling?


Show me the money

One of the Measure M programs that specifically funds active transportation is the 2% Active Transportation program (or 2% ATP). (Not to be confused with the State’s ATP fund!)

Image courtesy of: Los Angeles County Bicycle Coalition


2% ATP is estimated to generate approximately $17 million per year from Measure M. Program details are currently being developed by Metro, but objectives and eligible uses have been established.


Objectives:

  • Expand multi-modal connectivity
  • Improve the regional active transportation network


Eligible uses:

  • Active transportation and other capital that achieve 2% ATP objectives
  • First/last mile components of major capital projects listed in the 2016 Measure M Expenditure Plan

Two existing policies that will guide the development of 2% ATP are the Metro Active Transportation Strategic Plan (ATSP) and Vision Zero. These are critical frameworks that will shape the program’s planning and emphasis on safety.

  • Planning: Countywide funding needs for active transportation are huge. When Metro adopted the ATSP in 2016, staff estimated the cost of funding Countywide annual active transportation needs at low end of $737M and high end of $1.7B.
  • Safety: The adopted Measure M Guidelines  direct projects funded through Measure M to “support the protection of pedestrian and bicycle safety in parallel with Vision Zero or equivalent policies.” While the greater region currently lacks a countywide Vision Zero policy, it is crucial that traffic safety is a priority for active transportation investments.


The 2% ATP program will also coordinate with a number of related Metro plans and policies, covering Complete Streets, First/Last Mile, Sustainability, and Bike Share (22.1).


It is important to note that 2% ATP is not intended to be a standalone funding source for countywide active transportation needs and programs. Metro envisions this pot of Measure M funds as matching grant program for external funding opportunities (such as statewide ATP), and a competitive fund for regional active transportation projects.


Wait, can you show me more money?

Let’s recap:

  • 2% ATP is estimated to generate approximately $17 million annually for the entire region
  • Metro’s own ATSP estimate of regional active transportation needs total $737 million annually (on the low end) and up to $1.7 billion
  • 2% ATP is not intended to be a standalone funding source for active transportation projects


While 2% ATP is a step forward in identifying the health and safety needs for Greater Los Angeles that can be addressed through active transportation improvements, it clearly is not enough money to meet the identified countywide need. Fortunately, it is not the only source of active transportation funding in Measure M.


We have written about the $10 billion Multi-year Subregional Programs (MSP) in Measure M. Part of why we care so much is that is comprises the largest amount of dedicated funding for first/last mile, sidewalks, bicycle infrastructure, and safe routes to school in Measure M. For further explanation of the difference between 2% ATP and MSP, check out our March 6 #JustGrowth webinar (slides).


Since 2% ATP is eligible for matching funds, it will be critical to strategically leverage these limited dollars with other funding opportunities to most efficiently improve the health and safety of our entire region.


What’s next?

Metro staff is currently finalizing draft guidelines for 2% ATP. On April 5, Metro will be hosting a 2% ATP working group open to members of the Metro Policy Advisory Council (PAC) to further refine these guidelines. See the 2% ATP guidelines process below.

On April 4, Investing in Place will be hosting an open planning call with our #JustGrowth participants, and other interested parties, to weigh in on the development of 2% ATP guidelines, prior to the April 5 PAC working group. We are particularly excited to further develop the prioritization criteria for any 2% ATP competitive funds

For those interested in getting more involved in the MSP process, this is managed by the County’s nine subregions or COGs

Categories
Completing Streets Just Growth Measure M Uncategorized

Measure M Guidelines Adopted: Congrats Metro! We give you a B+


Since Measure M was approved by Los Angeles County voters last November, Metro has been developing the guidelines that will determine how funding from the new $120 billion transportation measure can be spent.

Today, the Metro Board of Directors adopted the Master Guidelines for Measure M.

It is the culmination of months of work and partnership from key community leaders like AARP, American Heart Association, Climate Resolve, Bike SGV, Safe Routes to School National Partnership, Los Angeles County Bicycle Coalition, Community Health Councils, San Gabriel Mountains Forever, Pacoima Beautiful, Trust South LA, Advancement Project, FAST – Fixing Angelenos Stuck in Traffic, LA Thrives, Enterprise Community Partners, ACT-LA and many many more.

After today’s Metro Board meeting and especially Motion 38.3 by Directors Garcia, Bonin, Solis and Hahn – we give the Measure M adopted guidelines a B+.  A shout out to all the Metro staff working hard to respond to concerns from a variety of stakeholders and perspective.

Click here to see our complete analysis.

We look forward to continuing to work with all our partners towards further developing the Measure M Guidelines with the administrative processes and the Long Range Transportation Plan. Join us for our #JustGrowth work group on July 18th where we will be discussing next steps. RSVP here.


Categories
Just Growth Measure M transportation equity

Our Analysis of the Measure M Draft Guidelines

After Measure M — the $120 billion transportation measure approved by LA County voters in November 2016 — passed, we asked our readers: how do we guarantee that current and future generations of families, especially in low-income neighborhoods, benefit and thrive with Measure M’s investments?

We heard loud and clear (and we strongly agree): we have to “bake in” equity into all of Metro’s programs, policies, and investments — this is one of the core concepts of our #JustGrowth work group.

The Measure M draft guidelines, released last month by Metro, is one of the first places to start (for background, read our recommendations from back in January)and today, we’re proud to release our analysis for your feedback and review.

Please click here to read our analysis.

The Measure M guidelines are the first opportunity to review Metro’s approach to implementing the promises made to voters to invest in building a safe, sustainable, and reliable transportation network for the region. Investing in Place reviewed these draft guidelines with an eye toward integrating the policy best practices we care about — including data-driven decision-making, prioritizing the needs of vulnerable communities, and valuing public participation — into all Measure M projects and programs.

In our report, we provide an overview of the guidelines and their role in implementation, highlight aspects we are excited about, and recommend improvements to ensure Measure M stays true to the progressive ideals that led to its passage.

We provided a suite of policy recommendations to ensure Measure M lives up to its potential during implementation. We believe Metro should:

  • Ensure all projects and programs funded by Measure M comply with Metro’s Complete Streets Policy;
  • Prioritize traffic safety–particularly for people walking and biking–in all funding programs for streets and highways;
  • Set clear objectives for each program in line with regional performance metrics;
  • Require transparency and public participation in all project development and prioritization processes;
  • Dedicate funding for countywide active transportation programs, including open streets, bike share operations, bike safety education, and safe routes to school non-infrastructure programs; and
  • Support innovation in the Multiyear Subregional Programs by expanding eligibility for planning, data collection, project development, and transportation demand management (TDM) and building capacity at each council of governments (COG).

To read our policy analysis, please click here.

Next Steps

On Wednesday, April 5th 1pm, Metro’s Policy Advisory Council will meet for the first time to discuss, among many things, the Measure M draft guidelines. We encourage you to attend and provide feedback. The meeting will take place on the 15th floor of Metro’s Headquarters (1 Gateway Plaza). These meetings are open to the public. Metro is accepting public comments on the draft guidelines through May 26th — we encourage all our partners to weigh in by emailing feedback to theplan@metro.net.

New Title

New Name

New Bio

Estolano Advisors

Richard France

Richard France assists clients with strategic planning, visioning, and community and economic development. He is a strategic planner at Estolano Advisors, where he has been involved in a variety of active transportation, transit-oriented development, climate change resiliency, and equitable economic development projects. His work in active transportation includes coordinating a study to improve bike and pedestrian access to transit oriented districts for the County of Los Angeles, and working with the Southern California Association of Governments to host tactical urbanism events throughout the region. Richard also serves as a technical assistance provider for a number of California Climate Investment programs, including the Affordable Housing Sustainable Communities, Transformative Climate Communities, and Low Carbon Transit Operations programs. He has also taught at the UCLA Luskin School of Public Affairs. Richard received a Bachelor of Environmental Design from the University of Colorado at Boulder, and his M.A. in Urban Planning from UCLA.

Accelerator for America, Milken Institute

Matt Horton

Matt Horton is the director of state policy and initiatives for Accelerator for America. He collaborates with government officials, impact investors, and community leaders to shape infrastructure, job creation, and equitable community development efforts. With over fifteen years of experience, Matt has directed research-driven programs and initiatives focusing on housing production, infrastructure finance, access to capital, job creation, and economic development strategies. Previously, he served as the director of the California Center at the Milken Institute, where he produced research and events to support innovative economic policy solutions. Matt also has experience at the Southern California Association of Governments (SCAG), where he coordinated regional policy development and planning efforts. He holds an MA in political science from California State University, Fullerton, and a BA in history from Azusa Pacific University. Additionally, Matt serves as a Senior Advisor for the Milken Institute and is involved in various advisory boards, including Lift to Rise and WorkingNation.

UCLA Lewis Center for Regional Policy Studies

Madeline Brozen

Madeline is the Deputy Director of the UCLA Lewis Center for Regional Policy Studies at the Luskin School of Public Affairs. She oversees and supports students, staff, and faculty who work on planning and policy issues about how people live, move, and work in the Southern California region. When not supporting the work of the Lewis Center community, Madeline is doing research on the transportation patterns and travel needs of vulnerable populations in LA. Her recent work includes studies of low-income older adults in Westlake, public transit safety among university students, and uncovering the transportation needs of women, and girls in partnership with Los Angeles public agencies. Outside of UCLA, Madeline serves as the vice-chair of the Metro Westside Service Council and enjoys spending time seeing Los Angeles on the bus, on foot, and by bike.

Office of Los Angeles Mayor Karen Bass

Luis Gutierrez

Luis Gutierrez, works in the Office of Los Angeles Mayor Karen Bass, as the Director of Energy & Water in the Office of Energy and Sustainability (MOES), Luis oversees issues related to LA’s transition to clean energy, water infrastructure, and serves as the primary liaison between the Mayor’s Office and the Department of Water and Power. Prior to joining MOES, Luis managed regulatory policy proceedings for Southern California Edison (SCE), focusing on issues related to equity and justice. Before joining SCE, Luis served as the Director of Policy and Research for Inclusive Action for the City, a community development organization dedicated to economic justice in Los Angeles. Luis holds a BA in Sociology and Spanish Literature from Wesleyan University, and a Master’s Degree in Public Administration from Cal State LA.

kim@investinginplace.org

Communications Strategist

Kim Perez

Kim is a writer, researcher and communications strategist, focused on sustainability, urban resilience and safe streets. Her specialty is taking something complex and making it clear and compelling. Harvard-trained in sustainability, she won a prize for her original research related to urban resilience in heat waves—in which she proposed a method to help cities identify where pedestrians spend a dangerous amount of time in direct sun, so they can plan for more equitable access to shade across a city.

EXECUTIVE DIRECTOR

Jessica Meaney

For over almost two decades, Jessica has led efforts in Los Angeles to promote inclusive decision-making and equitable resource allocation in public works and transportation funding. Jessica’s current work at Investing in Place is grounded in the belief that transparent and strategic prioritization of public funds can transform Los Angeles into a city where inclusive, accessible public spaces enrich both livability and well-being. As a collaborator and convener, Jessica plays a role in facilitating public policy conversations and providing nuanced insights into the interplay of politics, power, and process on decision-making and fiscal allocations.