With the first month of the new fiscal year gone, Metro is still operating without an established budget for 2021. When the Board of Directors returns from its July recess, they will immediately be tasked with sorting through the mess that Covid and attendant restrictions on businesses and personal travel have made of Metro’s revenue streams and operations so that they can adopt a budget. While there are no shortage of transportation projects in need of funding in Los Angeles, it remains to be seen what Metro will decide to prioritize during this period of widespread hardship. There have been some early indications as to the discussions going on within Metro, however, and, for bus riders, the signs are not entirely encouraging.
On May 26, an internal memo by Metro CEO Phil Washington was posted for review by the agency’s Board of Directors. The memo, which contained a detailed snapshot of the evolving financial impacts of the Covid pandemic on Metro, divided “all projects and programs” into two buckets. What Washington refers to as Bucket 1 contains capital projects for which work is already being carried out under the terms of an executed contract. By contrast, Bucket 2 contains those projects and programs that have not been contracted and which, consequently, stakeholders can expect to be subject to delays pending an improvement in Metro’s financial standing.
Missing altogether from either bucket is perhaps Metro’s most important initiative: the NextGen bus service reorganization. NextGen is the plan to save Metro from a decade of declining ridership, service quality, and rider satisfaction. NextGen was meticulously assembled over several years, as riders waited with strained patience for Metro to begin implementing the urgently needed system-wide improvements.
When Metro debuted the completed NextGen study in January of this year, the plan’s aims were clearly among the most ambitious that the agency had ever sought to achieve, in a category with the decades-long project to build the city’s subway or the still-elusive goal of tunneling under the Sepulveda Pass. But even Metro’s recent history is filled with false starts and plans that were announced with fanfare only to falter and ultimately result in no lasting changes for riders. This is why Metro’s silence on the priority of establishing dedicated, protected funding streams to keep NextGen moving forward is so concerning.
A full buildout of NextGen is proposed by Metro to take place over 6 years, including nearly $1 billion in capital spending and reallocated bus service hours creating an all-day frequent network the likes of which this city has not enjoyed since the glory days of the old streetcar networks, if ever. By contrast, without NextGen, Metro has no clear hope to establish itself as a high-quality transportation system for Los Angeles. The stakes are that high.
Within the first phase of the NextGen action plan, the number of high-frequency lines running service every 10 minutes or better was set to nearly double while the number of Angelenos living near high-frequency lines would increase by a stunning 238%. But without adequate funding, this plan cannot succeed. Indeed, the capital elements are essential to accomplishing the transition to a high-quality bus network.
A NextGen plan without funding, where stops are consolidated but service remains infrequent and the stop environment remains unfriendly will only further burden the Angelenos who continue to rely on Metro during Covid. And if Metro cuts bus service in response to Covid, the plan’s goals become that much further out of reach.
Budgeting during the time of Covid has been challenging. Uncertainty regarding aid bills at the federal level has trickled down to every other level of government, and Metro, like other agencies, is working to establish a path forward at this critical moment. But we are also in Summer 2020, beyond when work on NextGen was supposed to begin with no clear indication or commitment from Metro to proceed with its reconstruction of a bus network that was failing long before Covid reached our city.
Metro’s faltering relationship with bus riders is sufficient reason to view any unwillingness on their part to be direct about the future of NextGen with suspicion. It is time for Metro to state clearly that they will fund NextGen and how they intend to make sure that it is completed in full.
Over the course of the last several years, Metro has become increasingly focused on new construction of rail and highway megaprojects, sometimes even to the exclusion of other priorities, like improving the quality of service for existing transit riders.
We do not yet know what Metro’s budget for 2021 will look like. Metro has decided to delay adoption of a new budget until September and operate for the first quarter of the new year using continuing resolutions. Since March, the financial environment has changed dramatically between Metro’s last budget and the one that is currently being developed. And the Covid recession is still in its early days.
But even with all the unknowns, one thing can be said with certainty: Metro’s riders need Metro to focus its energy on building a more resilient and equitable transportation system. Rather than pursuing new megaprojects that have grown more difficult to manage and complete during the period of the current pandemic, Metro should be turning its attention to projects like the recent rollout of a small network of bus-only lanes in downtown Los Angeles. Such projects can be rolled out rapidly, cheaply, and without requiring a huge concentration of workers in one location.
Similarly, the NextGen Bus plan should be looked at for accelerated financing. The product of several years of study, NextGen produced an ambitious scope of change for how bus service should look in this region, including frequent service all day across LA’s most congested corridors. However, a full build out of the plan has a total cost in the billions and, as yet, no clear funding path to get it to completion.
For years now, Metro’s priorities have been dominated by the still far-off prospect of the 2028 Olympic Games. Less than a year following the passage of Measure M, Metro Chair Eric Garcetti proposed the Twenty Eight by ‘28 initiative, which sought to complete about 70% of the projects in the Measure M expenditure plan in the first decade of the new sales tax.
The focus on the Olympics and other planned megaevents – the Super Bowl in 2022, the World Cup in 2026 – has been a constant in Metro’s planning, from the decision to begin construction on the Centinela grade separation for the Crenshaw line to the Vision 2028 strategic plan.
While we don’t have a detailed picture of the future of Metro’s finances, we can expect financial pain in the short term. Mayor Garcetti recently said that Metro has a $1 billion budget shortfall. Additionally, we can expect that more and more Angelenos will return to the transit system as California continues its piecemeal reopening of the economy. Ridership on Metro is now back up to 525,000 daily rides after falling to 365,000 when closures were at their most strict.
Even more than usual during the pandemic, the bus has been the workhorse of the regional transportation network. During the early days of the safer at home orders, the ratio of bus riders to rail riders actually increased to 3.5 bus riders for every rail rider. This represents a long-held truth in who relies on transit in the LA Region, that rail riders are more likely to be riders of choice, more likely to work in office environments, and more likely to have the opportunity to work remotely. On the bus network, several corridors, particularly in South Los Angeles, experienced much less reduction in ridership than elsewhere, as a concentration of working class riders had no choice but to continue with the daily routine of their lives.
If we extend this out to the present, we can see we’re on a dangerous trajectory. As our region struggles with its reopening, we know that bus ridership did not fall as far as it did in other major American cities and we know that it is rising faster. The white collar workers who have had the benefit of sheltering in their homes will likely continue to be able to do so. In the meantime, more and more essential workers who ride the bus will be coerced to return to dangerous working conditions.
Metro has sought to keep buses from becoming crowded by adding back service in anticipation of growing ridership. But anecdotal evidence suggests buses and bus stops are still experiencing dangerous levels of crowding throughout daily operations (to date, Metro has not shared much official data on the crowding situation on its vehicles). Without a significant increase in bus service, that trend will continue, with buses increasingly serving as places where riders risk being unable to socially distance from passengers who are potentially carrying Covid. The implications are clear: Metro would not expect transit riders of choice to accept those conditions, and they should not be forcing those conditions on riders who depend on their service to make their way around town.
Without providing sufficient service for riders to be safe on their buses, Metro will risk accelerating in-progress trends away from transit ridership altogether. They will be establishing themselves as an agency who is unwilling or unable to protect riders, and buses will cement a reputation as spaces that are dangerous and full of disease, spaces where anyone with sufficient means would not willingly go. But it doesn’t have to be this way.
Metro’s push to accelerate Measure M projects has stretched the agency thin where capital funding is concerned. Additionally, that acceleration has often been directly contingent on the viability of finding private-sector partners who view growth in Metro’s ridership as a safe enough investment for them to take a risk on a future return. The current environment, one in which no one can say how long the Covid pandemic will endure, or, much less, what transit will look like when it does, does not seem like it lends itself to taking risks with huge amounts of capital.
Accordingly, we should assume that whatever possibility there might have once been to achieve ambitious plans around building new rail and highway projects for the 2028 Olympics has by now been extinguished.
Metro needs to acknowledge that Twenty Eight by 28 is no longer achievable, and that, in the current environment, it could no longer pursue the acceleration of nice-to-have projects to the exclusion of other goals even if it were. Put frankly, Los Angeles doesn’t have the luxury of spending nearly a decade dressing up to show off its prosperity to the world. Angelenos are hurting, economically, physically, and emotionally. What they need from their transit agency is a rededication to high quality service that is safe and that accounts for their needs and the bus operators serving them equitably.
In the immediate post-Covid period, that means Metro should do whatever it can as an agency to shift the focus of its capital priorities away from enormous megaprojects often with localized benefits in low-ridership environments toward a different kind of megaproject: regional investments in course correcting the fundamental service proposition for existing riders where ridership is highest. Planning for this has already been completed in Metro’s NextGen study, but NextGen remains absent from discussions around capital funding and has received little institutional urgency from the board of directors compared to other priorities for funds. In this moment, the visionary NextGen plan, rather than parochial rail construction, is what is needed to reintroduce Angelenos to their transit system and to Metro itself.
Metro also needs to reexamine some of its long and stubbornly held policies regarding the built environment in Los Angeles. Metro has sought to stay out of discussions about what bus stops and city streets should look like, while also refusing to install bathrooms or other hygienic stations at its own property at rail stations throughout the county. But Metro can no longer afford to stay out of these fights. There are nearly 100 rail stations throughout Metro’s service area. At these locations, Metro should be looking into self-washing restrooms and sanitary stations that can help keep riders and the public safe. Making it possible to safely be out in public as additional industries resume work will be paramount to our success in reopening Los Angeles.
Similarly, although spending authority might belong to individual cities where streets and bus stops are concerned, Metro serves as one of the largest grantors of funds in the county. As such, Metro can use its position to incentivize cities to make changes to city streets to keep buses from getting caught in traffic, to alleviate transit crowding, and to make the stop environments safe and sanitary. These are capital projects as well, and they are projects that have not been complicated by Covid the way that enormous rail and freeway construction projects have. It is Metro’s responsibility to ensure that Los Angeles does not merely return to a status quo that was failing so many. It is time to think instead about how we can emerge from this crisis into a stronger, more equitable city.
For over five years, one of Metro’s biggest concerns has been trying to reverse the downward plunge of bus ridership. We must take it then as a sign of our extraordinary times that, in a matter of weeks, the agency’s mindset has been inverted completely: who would have imagined at the start of the year that by April Metro would be telling people to stay off transit for all but the most essential trips?
Throughout the past two months – as stringent restrictions on business operations and personal movement have been enacted to slow the spread of COVID-19 through Los Angeles County – Metro has been forced to repeatedly modify bus and rail service, making major cuts across the board. This has been necessary, according to Metro, in order to adjust to reduced passenger demand and an increased number of driver call-outs each day (Metro estimates a range of 25% – 30% of staff have been unable to work during COVID-19).
During April’s Operations Committee meeting, Conan Cheung, Senior Executive Officer for Operations, announced the latest plan for bus and rail operations, which went into effect on April 19th. The new service changes call for buses and trains to run on Sunday frequencies every day of the week, with trips also being added back for lines that do not usually run on Sundays to retain basic coverage for those riders.
With these changes, Metro says that they have established a baseline of service at which transit riders will not be forced to breach social distancing requirements, while also allowing for the agency to save money and maintain more reliable service for the remainder of the Covid crisis. However, by relying on the pre-existing Sunday schedule, Metro has disproportionately reduced transit for bus riders, exposing them to longer waits and more crowded waiting and riding experiences. If they want to ensure safe and rider-centered transit for the frontline workers and the unhoused Angelenos who are currently most reliant on their service, Metro must add back bus service above the current baseline. Metro is working to do this on corridors such as Slauson, Olympic, Broadway in South LA, 3rd Street and more – where they are increasing bus service and adding articulated buses. Metro reports that 43% of the bus riders along the South LA Slauson are still riding. We are eager to see this type of data as it is showing key lifeline bus routes that need increased service now and going forward.
Bus riders have always made up the majority of Metro’s ridership; in January, they outnumbered rail riders 2.5 to one. This massive disparity has grown only larger since the issuance of state and local Safer at Home orders. Since that time, comparatively wealthier rail riders have been more likely to be able to forgo transit trips. Metro reports that rail ridership is down three quarters compared to 65% on the buses. That means that as of March, bus riders now outnumber rail riders 3.5 to one.
Despite this, it is bus riders who will bear the brunt of Metro’s new schedule changes, unless new bus service is added. Last month, the Metro Board approved cuts that eliminate 29% of service hours for bus lines compared to 14% of service hours for rail lines. Additionally, while, on the rail network, Metro has pledged to continue running full train-car consists in order to facilitate distancing, on the bus network no such measures are available, unless we see targeted increased bus service using articulated buses implemented.
Without targeted increases to bus service, we might expect that Metro’s buses will become too full for passengers to distance and that riders will be left waiting long intervals for buses at stops where practicing safe distancing is generally difficult on narrow sidewalks.
Last month, when Operations Committee Chair Mike Bonin brought up the heavy cuts to bus service, he was told by Cheung that Metro wanted to use Sunday service as their guide because riders already had familiarity with that schedule, allowing them to make the change more quickly. While it is important to acknowledge that Metro is being forced to act faster than ever these days – service changes being normally accompanied by public outreach campaigns – it doesn’t stand to reason that the Sunday schedule will be more easily understood by riders.
It is true that some passengers may have experience riding transit on Sundays, but for riders accustomed to riding to work on other days of the week, it is unlikely that they would be familiar enough with Sunday service to make a seamless transition to the new, significantly-reduced headways.
Some friction is no doubt unavoidable, but Metro should be leading in this moment with safety and transparency rather than simplicity as a guide. To that end, ACT-LA submitted a letter requesting that Metro restore bus service on high-demand corridors in order to protect passengers from crowding that might occur during the course of the day. This would mean a marginally greater expenditure for Metro, but it would prevent the close-quarters contact that can be the difference between life or death right now. More than attempting to find the minimum level of service that can be easily achieved, promoting safe distancing practices should be Metro’s aim.
In response to a question about crowds on Metro buses, staff responded that they were utilizing on-board passenger counts and social media to determine whether or not buses might be too full. But neither of these can be relied upon to allow Metro to supply additional service when and where it is needed. Metro reviews passenger counts on a monthly basis, which means the information will come too late for Metro to use it to prevent person-to-person transmission of Covid.
Checking social media is a good but insufficient strategy: it means Metro will only know about crowded vehicles when a social media user – likely younger, wealthier, and whiter than the median transit rider – happens to be on-board and contact the agency. There is no solution to the issue of intermittent crowding on Metro buses that doesn’t involve increasing service.
The vast majority of rides taking place on the bus network right now are riders whose jobs have been deemed so essential that they do not have the luxury so many of us take for granted – the ability to be Safer at Home. Metro’s service changes seem to suggest that it wants to operate as much as possible like it is business as usual. But there is nothing usual about this moment in time. For the essential workers who still rely on transit, and for the rest of us who depend on those workers, the bus trips that are being taken right now are more important than ever.
At the May Operations committee, we encourage Metro to share data on COVID-19 trends on specific bus routes and continue to share this data going forward to inform the COVID Recovery Task Force and NextGen implementation and prioritization. Over 340,000 trips have been made every day on Metro bus and rail during Stay at Home orders, understanding where key essential trips are happening and additional buses are needed is critical. Investing in Place supports Better Buses for LA and the Metro staff and operators who are working incredibly hard to respond and serve our communities, however we see a breakdown from Metro Executive Leadership and the Board in sharing this information and having a much needed conversation about what is happening on our streets now. The Board is sharing aggregate data reports on transit service but our communities, policymakers, transit operators and local jurisdictions need real time data for specific lines and neighborhoods as the COVID-19 recovery policies and programs begin to be developed.
Los Angeles community members are currently under state, county and city stay-at-home orders. Public Health experts strongly suggest continued mitigation strategies to prevent coronavirus transmission for the foreseeable future. For the transportation field, this means almost every aspect of the industry – mass transit, rideshares, taxi, bike/scooter share, parking, tolls, and gasoline – is being negatively impacted and drastically changed.
For LA regional transit, initial reports from Metro staff show that bus ridership is down 70% and rail ridership is down 85%. This is good. We want people to stay home right now. And while still so much is unknown about COVID-19 – one thing that is undeniable, the impacts are and will continue to be the hardest for Black and brown and low-income households – who are the majority of Metro’s transit riders and have few safe and reliable transportation options. Many essential workers from these communities rely on transit to get work, stock grocery store shelves, prepare take-out meals, provide health care services, and take care of the region. These households also have members who are staying home but still rely on transit to access a grocery store or food pantry and medical services. How is our region and our transportation ecosystem taking care of these folks right now? And what about when we enter the recovery phase?
Investing in Place has been exploring the implications of COVID-19 for transit service, transit riders, and transportation plans and projects. We’re finding ourselves with more questions for Metro, than answers from them. At the crux of our questions is equity.
Metro is in for a major decline in revenue, which means there will be some big and tough decisions for Metro leadership to make. How will smaller cities fare? What plans will Metro advance, and which will be tabled? In the midst of this crisis, and then during recovery, will Metro lead with the goal of ensuring safety and access for those who are most exposed and most vulnerable in its system: bus drivers and bus riders?
Transparency in Budget Impacts and Decisions
Transportation agencies need to be nimble and rise to the occasion. Metro must demonstrate leadership and help get us past this historic pandemic. Metro plays an essential role, no agency is more important for planning LA’s transportation system than Metro. While Metro is best known for running buses and trains, they do so much more. Metro also funds local street and highway projects, and serves as a real estate developer for land it owns and leases near transit stations. And each year, the agency directs the investment of billions of dollars from sales tax revenues (Propositions A and C and Measures R and M). Metro directs funding for local cities and councils of governments, carpool lanes, sidewalk repair, rail construction, bicycle lanes, bus service, and other projects and programs that affect how we get around the Los Angeles Region. It is critical that Metro’s response to the COVID-19 crisis leads with equity, upholds clear and consistent communications, and demonstrates transparency.
Metro CEO Phil Washington has stated that he anticipates an $800 million dollar shortfall in Los Angeles County transportation sales taxes over the next several months. Last year Metro had a $7 billion dollar annual budget – so the projected financial loss represents 11% of Metro’s budget. It’s likely that the deficit will continue to grow.
How will Metro address these shortfalls? Which projects will be cut, which services will be prioritized and funded? How will cities, communities, and stakeholders be involved in this prioritization? How the agency addresses equity in broader planning, programming, and investment decisions will be critical. Will the agency reduce or have free transit fares to support low income households and the influx of unemployed people?
And how will Metro prioritize the coming relief from the Federal Bill: 3548 The Coronavirus Aid, Relief, and Economic Security Act which will provide $710 to $810 million, or even up to $1.2 billion, in assistance to LA Metro. Will this funding go towards bus and rail operations, capital projects? And how will this relief funding be prioritized?
Metro’s COVID-19 Response and Recovery Will Reflect its Values
And after several years of developing an Equity Framework – Metro has the guiding principles in place to center equity in its crisis response. Last summer, Metro adopted its first-ever agency wide definition of “Equity Focused Communities.” This definition identifies two demographic factors that have historically been determinants of disinvestment and disenfranchisement, as well as a third factor Metro added to the mix: (1) race/ethnicity, (2) household income, and (3) households with low vehicle ownership.
We are entering a massive recession and transportation budgets will shrink in the aftermath and throughout the recovery from the COVID-19 pandemic. An important question now is: how will Metro use its Equity Focused Communities to inform recovery? Key decisions will have to be made.
Metro leadership needs to clearly articulate the outcomes they are working towards during the pandemic and once we enter the recovery phase. The agency should set metrics and clear and communicated guiding principles for changing investments, programs and stakeholder engagement. Will Metro’s COVID-19 recovery strategies be motivated by making Measure M and 28 x 28 capital projects whole again? Or is it focused on providing good services, getting NextGen back on track and prioritizing our most vulnerable communities in recovery? Metro operates as one of, if not the biggest transportation funder for 88 cities, unincorporated Los Angeles County, and over 30 municipal transit operators (think Big Blue Bus or Foothill Transit). Setting regional goals and metrics, and establishing leadership and clarity in communications now is critical.
Data
While Metro is more than just buses and trains – it’s a regional transportation agency – getting it right on transit right now is key. If we are leading with the goal of safety and access for all of those on the bus – both bus drivers and passengers, we need transparency on data and funding and clear ways for stakeholders to understand the trade-offs being made before policy decisions are made.
Data is essential to making informed policy decisions that, in this case, prioritize shrinking resources. Metro needs to publish bus and train ridership data weekly to identify where ridership is dropping off during the pandemic, but more importantly what are key lifeline transit lines for essential workers and essential trips? This data should also be coordinated with local cities/municipal transit operators to create a more informed picture of what is happening on the streets and what travel demand looks like during COVID-19.
Response and Recovery efforts must be grounded in equity
This week Metro has their first Metro Board committee/meeting cycle while operating under COVID-19. How the agency addresses equity in broader planning, programming, and investment decisions will be critical. And although everything in the transportation field right now is in flux, one constant remains: the inequities that characterize our transportation network continues to reflect years of inequitable public policymaking and a persistent lack of investment in lower-income communities and communities of color. As we look at the immediate response to the COVID-19 crisis, we should not lose sight of this reality. In response to the pandemic, Metro’s short term goal should (rightly) focus on advancing public health goals and protecting the most vulnerable among us. But as we look ahead to our recovery from this crisis, our goal should not be a return to “normal.” The status quo was not, is not, and will not be satisfactory. Instead, we should demand a recovery plan that emphasizes our goal of creating a transportation network (and a transit system) that reflects our broader desire for a more inclusive, just, and resilient society. Now, as we prioritize the safe transit of essential workers and our vulnerable neighbors, Metro leadership must also consider how this approach can inform our changing world. That means looking at ways to permanently implement fare-free transit for low-income transit riders, prioritizing investments that create a safe and reliable bus network for historically marginalized riders, and coordinating with local jurisdictions to prioritize transportation investments that expand access and opportunity for underserved communities. Right now, more than ever, Metro leadership needs to ensure that the agency’s response and its broader recovery efforts are grounded in equity.
Next Steps:
Attend the April 14th Better Buses Work group meeting via zoom (This work group is open to all. We meet monthly on the 3rd Tuesday of every month from 3:30 – 5:00pm.)
The Metro Board of Directors meetings scheduled for March were postponed due to the COVID-19 pandemic. In order to comply with local and state directives limiting the number of people that can gather, the Board will forgo holding meetings at Metro headquarters and instead hold virtual meetings. Board Committees will take place on Wednesday, April 15, and Thursday, April 16, and the full Board meeting will be Thursday, April 23.
All of the meetings will be accessible via video stream at http://boardagendas.metro.net or by phone by calling 213-306-3065 and entering the meeting ID number associated with each meeting.
A written public comment submission period will open up 72 hours before each meeting. Because in-person comments are not possible, the public will have the following three methods to provide public comment:
By emailing your comment before the meeting to jacksonm@metro.net, making sure to note the agenda number and item along with your comment
Guest Blog Post by Felipe Escobar, Pacoima Beautiful
Bus shelters make a difference for transit users, particularly on hot days in the San Fernando Valley. These bus shelters are only becoming more necessary as climate change brings hotter days to our communities. In fact, according to a study by UCLA, the number of hot days (95 degrees plus) could triple by 2050. This figure is troublesome because having shade on a hot day can determine how comfortable a person is, especially when having to wait for a bus for an extended period. For transit users in the northeast San Fernando Valley, one of the hottest areas Los Angeles County, not having shade, is a reality that is lived at many bus stops. This is why Pacoima Beautiful together with Investing in Place, Outfront/JCDecaux and Climate Resolve, are teaming up to create a model that benefits the areas that needed the most by working to install 10 bus shelters in Los Angeles City Council District 6.
This gets us one step closer to achieving environmental justice for our communities. We know that because of poor planning, communities in the northeast San Fernando Valley lack necessary infrastructure such as sidewalks, stormwater drainage, and parks for residents to escape to on hot days. According to the LA County Parks Needs Assessment, Sun Valley only has 1.6 acres of open space per 1,000 residents. This is the story in many communities in the nation where necessary infrastructure was only added in affluent neighborhoods.
“The Shade is important. It is too hot, and we could pass out, especially when the bus takes a long time. This is urgent.”
Transit user
The Bus Shelter Blitz seeks to add more bus shelters to areas that need it the most.
The Bus Shelter Blitz is an effort to address shade and heat issues for residents that use public transportation. As part of the collaboration, Pacoima Beautiful conducted on the ground outreach throughout the district to determine the areas with the higher needs for bus shelters. In September, Pacoima Beautiful members conducted in-person interviews at different sites identified as possible sites through GIS mapping and METRO’s ridership data.
We were able to talk to 196 people during the outreach period. The ten bus stops that were most frequently selected by residents, and which we have also determined to be feasible to submit for permits are as follows:
EB Vanowen NS Amestoy
NB San Fernando NS Sheldon
Van Nuys Blvd at Chase
NB Van Nuys FS Victory
SB Lankershim NS Stagg
NB Sepulveda NS Saticoy
NB Lankershim FS Tuxford
WB Sherman Way FS Tuxford
WB Sherman Way FS Van Nuys
NB Van Nuys NS Vanowen
SB Van Nuys NS Arleta
“It will be good to have bus shelter because there are children and elderly people under the sun waiting for the bus” Transit User
The benefit of the Bus Shelter Blitz project is that it focuses on a ground-up approach for designing what amenities to bring to a community as opposed to historical birds-eye view where people not familiar with the community’s conditions decide what improvements to bring to an area, often this approach results in mismatched projects that do not bring any real benefits to communities, and it leaves residents unhappy.
As we move forward in striving to make communities more resilient to climate change, we need to continue to implement solutions that begin with those most affected and vulnerable. There is also a need for less red-tape to get much-needed amenities out to the communities. Currently, a challenge to getting bus shelters approved is the dense bureaucratic red tape that a request for bus shelters needs to go through. A request for bus shelters goes through different agencies and council offices for review. A solution can be to simplify the request process by reducing the number of eyes that needed for approval and making the request for new shelters available through different venues such as in-person, phone, and online.
“I just got out of the hospital and to be waiting under the sun for the bus is unbearable” Transit user
Projects such as the bus shelter blitz is a good model where those most impacted by heat while waiting for their bus have a say on which areas to prioritize. Climate change is affecting transit users in Los Angeles every day, and by making sure our transit users have adequate shade is one way we can work towards making our communities more resilient.
Guest blog post by Slate-Z Communications Associate: Josie Clerfond
Less than 25% of bus stops in the city of Los Angeles have a bus shelter.
Given the scarcity of shade in Los Angeles, rising temperatures, heat-island effects of cement, this is a significant issue for riders who do not have a sheltered place to wait for their bus. Exposing people who ride the bus to rain, sun, and excessive heat is a public health concern. As noted in the New York Times article Why Shade is a Mark of Privilege in Los Angeles, this issue impacts community members in the South LA promise zone disproportionately, due to relatively higher rates of use of public transit in South LA neighborhoods and lower amounts of tree cover.
A grant from the 11th Hour Project, secured in partnership with Investing in Place, offers funds for community organizing for new bus shelters in Council District 8 — stops where people who ride the bus currently stand exposed to the elements. The Bus Shelter Blitz, as the project has been called, has been working to determine where the bus stops should go in Council District 8 has been a process led by SLATE-Z. (And in San Fernando Valley led by Pacoima Beautiful.)
New bus shelters will entail:
Permanent shade structure with a bench
Hydration stations (water fountains) where feasible
Where should new shelters go? Over 300 Surveys Conducted
SLATE-Z Conducted community outreach at events and in neighborhoods in South LA.
At the Central Avenue Jazz Festival on July 27th and 28th, 2019, we conducted written surveys on which respondents could circle their top 10 preferred bus shelter locations and provide feedback about the transit experience.
At the Taste of Soul Festival on October 19th, residents engaged with our digitized survey, through which they could select their top 10 bus shelter locations and provide feedback on various issues of transportation safety. Through this second iteration of our outreach efforts, SLATE-Z was able to collect useful data and achieve a greater understanding of transit needs in CD 8.
And this November, Slate-Z deployed a team of our partners at CD Tech on a door knocking campaign throughout the district. Our survey, which was available in both English and Spanish, facilitated discussions and the ability for residents to shape the transit infrastructure that affects their daily lives. In contacting over 300 South LA transit riders, our Bus Shelter Blitz campaign completed a large mobilization effort to obtain the necessary community input and ideas. This process allowed us to hear from those who regularly utilize the transit services we seek to improve.
Based on this outreach, the top 10 feasible and community prioritized locations in Council District 8 are:
Western Ave & Adams Blvd bus stop (North bound)
Western Ave & Exposition Blvd bus stop (North bound)
Western Ave & Florence Ave bus stop (North bound)
Figueroa St & Florence Ave bus stop (South bound)
Vermont Ave & Exposition Blvd bus stop (South bound)
Crenshaw Blvd & Slauson Ave bus stop (North bound)
Florence Ave & Vermont Ave bus stop (West bound)
Western Ave & Century Blvd bus stop (North bound)
Western Ave & Florence Ave bus stop (South bound)
Vermont Ave & Manchester Ave bus stop (South bound)
SLATE-Z is currently in contact with Council District Member Marqueece Harris-Dawson, and will submit the above sites for permitting. Stay tuned for bus shelter installations coming in 2020.
Other major findings:
We conducted comprehensive outreach regarding the public transit experience in Council District 8. Residents had the opportunity to provide open-ended feedback on what is necessary to improve their transit experience. Overwhelmingly, respondents identified the need for increased safety and security at bus stops and on buses. Safety—both on the buses and at bus stops—was determined to be a major concern for people who ride the bus.
The timeliness and frequency of buses was another challenge illuminated by survey respondents. SLATE-Z continues to advocate for community-led infrastructure improvements the improve transportation options for community members – especially those with the least options. We understand that ease of mobility for South LA residents is crucial to their safety, quality of life and economic success.
This week the City of Los Angeles Public Works and Gang Reduction committee will hear staff recommendations from the Bureau of Street Services (BSS) on what to do about bus shelters (including trash cans), automated public toilets, and digital advertising panels on sidewalks. The Bureau of Streets Services proposal reads as an effort to commercialize every inch of ADA compliant space on the City’s sidewalks, as opposed to one looking to serve people who ride the bus, or who walk or roll to crucial community assets like schools, hospitals, grocery stores.
Investing in Place asks its partners and supporters to write the City Council and ask them to develop a guiding policy and vision for our City’s sidewalks. We need a guiding vision that leads City Departments and all subsequent policies impacting the public right of way, on the path to becoming a walkable and rollable city with vibrant and inclusive sidewalks serving multiple needs and community uses. Some specific thoughts on the proposal and contact information for the committee members can be found on the bottom of this post.
Currently, the City of Los Angeles has no guiding policy or set of metrics informing the development of a walkable and rollable city with vibrant and inclusive sidewalks serving multiple needs and community uses. The only sidewalk program the city has is one based on litigation settled in 2015 (Willits v. City of Los Angeles), and most recently the “Risk Reduction Program,” which conducts spot fixes (that are not ADA compliant) on sidewalks with known tripping hazards from previous trip and fall lawsuits. Last year, the City of Los Angeles fixed 18 miles of the City’s sidewalks. It’s estimated over 4,000 miles of the City’s sidewalks are in disrepair. At the rate the City of Los Angeles is investing in its public right of way, it will take over 200 years to have an accessible and walkable/rollable city. And we would argue, simply achieving compliance of the Willits lawsuit settlement will not result in a walkable and rollable city. Additionally, the program is woefully under resourced and does not require the City to build new sidewalks where none exists – it is limited solely to repair of existing ones.
The City’s approach to bus shelters hasn’t fared much better than sidewalks. The City’s bus shelter program has been failing sinceController Wendy Greuel’s audit in 2012. While we fully support an effort to increase the provision of bus shelters, public bathrooms, and wayfinding signage – we believe the current proposal before the Public Works Committee falls short. It is silent on how commercializing the public right of way will serve people who use sidewalks and bus stops.
Sidewalks serve many purposes in the City of Los Angeles, and without a guiding policy or vision from policymakers rooted in supporting many uses, we will continue to see inconsistent policy decisions and priorities for this critical public, shared space. For instance, it took the City years to legalize street vending, and now as the City works to create a permit program for street vendors(a program also managed by the Bureau of Street Services), advocates are fighting back against proposals that would require vendors to pay $541 to obtain a permit. These initial costs seek to gain revenue for the city, without taking into account how it impacts the livelihoods of low-income entrepreneurs and the elderly who rely on vending to pay their bills. And earlier this year, the City struggled to reconcile policies for people who have nowhere to sleep but the sidewalks, with one proposal from policymakers that sought to make it illegal for people to sleep on the majority of sidewalks.
Now more than ever, the City needs to pull together the many needs, uses and challenges existing on its sidewalks and public right of way and create a unifying public policy and vision for one of the City’s most important assets and public spaces – sidewalks.
If policymakers decide to adopt the BSS proposal and commercialize the City’s sidewalks we must ask ourselves: Who will benefit from this proposed revenue source? Given the lack of existing policy and vision, and lack of specifics on how revenue will be used in the BSS report it is unclear to us if funding will be used to build and fix sidewalks, reduce permit costs for street vendors, or provide clean and safe bathrooms. The City’s priorities should be clear and transparent.
We’ve witnessed the power of our allies in the LA Street Vendor Campaign, who have advocated for a just system that allows low-income entrepreneurs the opportunity to use the public right of way in a safe and respectful manner. And our allies advocating for more shade and street trees continue to sound the alarm about the removal of trees and lack of an urban tree canopy. And we have been a part of sidewalk advocacy Tripping Point Summits and community organizing efforts to see bus shelters installed and more. And lastly, our City’s grappling with a chronic homelessness crisis is making it more and more clear that Los Angeles needs a vision for our sidewalks that unifies marginalized communities and directs Departments to support the historically disenfranchised.
We see so much organizing and interest from community members to have their sidewalks meet the needs of their communities. But the report posted from Bureau of Street Services last week is silent on these community efforts and how advertising revenue will address the myriad of issues faced by Angelenos, especially those in low-income communities. While the report does look to the future by calling out the 2028 Olympics, we believe that it’s not enough. Our public spaces should serve the needs of Angelenos, not sporting events.
It’s time for the City of Los Angeles to adopt a guiding policy and vision that improves the public right of way for all Angelenos and their needs, but especially the most under-represented and marginalized. Los Angeles deserves sidewalks that are accessible, safe, and vibrant.
What’s in the BSS Staff report and being decided?
BSS staff is recommending that Los Angeles City Council reject Outfront Media/JCDecaux proposal to extend their existing street furniture contract, and let that contract expire on 12/31/2021.
Negotiate the sale of existing street furniture or direct Outfront Media/JCDecaux to remove all existing street furniture.
And BSS seeks authorization to begin working on requests for proposals (RFP) to secure a new program through the Board of Public Works that will:
Do a request of information to inform BSS RFP process on best practices.
Explore business models and options for the City to share a portion or 100% of the capital expenditure to maximize revenues for the City.
At a minimum, provide shelters in each Council District to achieve 75% transit ridership coverage with priority given to “districts with the highest needs.”
Eliminate Exclusive Advertising
Provide expanded advertising opportunities.
Bureau of Streets Services/Streets LA also is seeking approval to:
Work with the Department of Convention and Tourism Development.
Create a sidewalk, parkway and roadway inventory of all street furniture – coordinating with other LA City departments, Metro and other municipal transit providers to develop the inventory.
Maximize the the street furniture program and revenues for the 2028 Olympics and ParaOlympics.
Create a streamlined process for installing street furniture based on approval of a development plan one year at a time.
The City Council Public Works and Gang Reduction Committee is chaired by Councilmember Bob Blumenfield and includes Councilmembers Joe Buscaino, Nury Martinez, David Ryu, Mitch O’Farrell and Monica Rodriguez. Emails on this proposal can be sent to the committee staff member, Michael Espinoza at Michael.Espinosa@lacity.org. Printed copies of the email will be in the packets handed to Councilmembers and forwarded to Council staff.
Here are some points to highlight in your email:
NEED FOR A CITYWIDE SIDEWALK GUIDING POLICY AND VISION, among City Departments and all policies impacting the public right of way that sets the City on the path to becoming a walkable and rollable city with vibrant and inclusive sidewalks serving multiple needs and community uses.
WHAT HAPPENS TO FUNDS RAISED BY THIS PROPOSAL – When advocates approach the City of Los Angeles to fix its sidewalks and expand its small sidewalk repair program, we hear, “it’s too hard, let’s downscope and try pilots, let’s focus on spot fixes.” Any money raised by commercialization of a public space should be used to improve our public spaces.
HOW DO WE BUILD AND MAINTAIN “NON REVENUE” BUS SHELTERS – This proposal has one whole sentence dedicated to the need to provide bus shelters that don’t increase revenue for the city. While this new program is a great, and much needed, idea it raises a lot of questions about transparency and equity. If the BSS is serious about creating a new program in the public’s right-of-way it should be the focus of more than just that one sentence. A real place would include goals, metrics, accountability, transparency, funding sources, and more.
HOW DO WE MAKE SURE EVERY PART OF THE CITY IS GETTING ENOUGH BUS SHELTERS – One of the recommendations for the program states, a goal of providing bus shelters to “At a minimum, provide adequate number of bus shelters in each council district to achieve 75% transit ridership coverage with priority given to District with highest needs.” How will this program define High Need? Is it lifting up the work done in previous City departments to do this and align programs?
This summer the Metro Board of Directors took a giant step towards defining and mapping high need communities in Los Angeles County, and applying this definition to evaluate planning efforts and resource allocations – namely NextGen and Congestion Pricing.
“This definition identifies two demographic factors that have historically been determinants of disinvestment and disenfranchisement: household income and race/ethnicity.”
And Metro adds a third factor to the mix: households with low vehicle ownership. Using these 3 factors to create a map of high need neighborhoods and communities in Los Angeles County, Metro can now evaluate and prioritize where key transportation investments and policies can have the greatest impact on increasing access to opportunity. This is an important step forward for the agency, as you can not measure what you don’t define. This motion builds upon previous work from Metro and their 2018 Equity Platform, and takes the needed steps to operationalize and apply the Equity Platform.
As Metro and local jurisdictions look to accelerate projects and leverage the nearly $2 Billion in tax dollars coming into the County each year for transportation investments – how are we ensuring that these investments will lead to a healthy, equitable region? Equity Focused Communities now changes that by providing an agency wide starting point to to do that (in the past Metro has been defining equity project by project – resulting in a huge variety of definitions, strategies, and impacts from Metro to address equity).
“Adopting a working definition for use during the critical planning efforts underway, most notably the NextGen Bus Study and the Congestion Pricing Feasibility Study, would result in real benefits for communities that have waited a long time for their needs to be addressed equitably.”
This definition was developed as part of the Long Range Transportation Plan Draft Values Framework where Metro staff have been working with USC Program for Environmental and Regional Equity (PERE) research experts and the Metro Policy Advisory Council and other stakeholders.
Next Steps?
After adopted Equity Focused Communities as a working definition under the first pillar of the equity platform, Metro will be using it to evaluate scenarios on planning efforts currently underway – including NextGen and Congestion Pricing, along with supplemental metrics if necessary and appropriate.
Continue to refine the definition and applicability of Equity Focused Communities through the development of the Long Range Transportation Plan and in consultation with the Policy Advisory Council and Chief Equity Officer.
When Metro merely mitigates for inequitable impacts of already formed projects, Metro sustains economic disparities to resources and opportunity throughout greater LA.
—
Today, Metro attempts to achieve equitable outcomes by minimizing disparate impacts on new projects. Metro projects routinely include mitigation measures to compensate for the parts of a project they see negatively impacts communities that Metro defines.
Compensation plus systems change is needed to address inequity’s root cause. Discriminatory public policy like redlining starts with exclusionary thinking and abets discriminatory outcomes when applied to investments over time. Rather, Metro can achieve fair (read: equitable) outcomes by acknowledging the role its legacy has played in the past. In their Equity Platform Framework, Metro acknowledges that “historically and currently, inequity exists and has been largely defined by race and class – as well as age, gender, disability, and residency. Metro commits to working with historically underserved communities to establish meaningful equity goals.”
Once Metro’s choices reflect a trend of more equitable outcomes then Metro can more genuinely engage with the public to shape and fulfill initiatives that not only lower travel burdens butalso transform underserved communities’ access to resources and opportunities. Metro’s 10-year strategic plan (Vision 2028), which the board adopted in 2018, further commits the agency to equitable outcomes. Here, the author of this article recaps Metro’s prior missteps and reviews the agency’s current attempts to more equitably serve LA’s residents and visitors than Metro has in the past.
How has Metro involved equity in the past?
Since April 1993, the state of California has authorized Metro to plan, fund, build, and operate LA County’s transportation system [1]. However, Metro has not always carried out its duties fairly. In fact, over the last three decades Metro has gone from being sued for overlooking its most vulnerable customers to now mitigating for inequitable outcomes of Metro initiatives. Next, Metro should prospectively apply equity to transform greater LA into a thriving region.
Below is a summarized timeline of how Metro has involved equity in the past.
I. Mandated compliance with Bus Riders Union/Metro consent decree
Long before Metro’s founding in 1993, LA transportation officials ambitiously sought to grow a rail transit system that effectively outshined their efforts to cultivate a robust and reliable bus network. In the early 1990s, LA County bus riders — who overrepresented LA County’s population of people of color — shouldered the burden of the regions’ investment in growing a rail network (arguably still the case today). For instance, in 1992, Metro’s buses “carried 94 percent of the agencies ridership, yet the agency dedicated less than a third of its annual budget to bus operations.” At the same time, an overwhelming majority of the agency’s budget (71 percent) went to budding rail programs “that served only 6 percent of Metro’s ridership” [1, p. 163].
While the total number of rail riders was limited by a scant rail network at the time (only Metro’s Blue line was open by 1992), transportation officials willingly decided to invest in rail transit to an extent that dwarfed their investment in bus transit. Rail transit generally costs transit agencies more than bus transit to build and operate because of the many expensive components of rail transit like installing steel tracks and electrical power systems. Although bus passengers in the early 1990s were crowding onto Metro’s buses, transportation officials failed to invest in ways that would directly alleviate overcrowded buses by buying more buses or by operating buses more frequently and reliably in dedicated bus lanes, for example. In spite of this paradigm, LA’s transportation officials in 1994 proceeded to propose a fare increase whose burden would fall heavily on Metro’s bus riders, while simultaneously spending on expensive rail expansion.
In 1994, the Bus Riders Union (an organized coalition of bus riders) and their attorneys from the NAACP’s Legal Defense Funds (LDF) successfully stopped Metro’s proposed fare hike. In 1996, U.S. District Court Judge Terry Hatter Jr. ruled that such a fare hike would result in “disparate impacts” to the Metro’s bus riders who were over 80 percent people of color. By comparison, people of color comprised of less than 60 percent of LA County’s population at the time [1]. Now popularly known as the ‘consent decree,’ this court order precipitated a cap on Metro’s transit fares for 10-years (which has since expired in 2006) and required Metro to buy more buses to alleviate overcrowding. Significantly, this intervention shifted Metro’s attention to address the needs of their current (mostly bus) riders who overwhelmingly represented low-income communities of color, which remains the case today.
II. Indirect attempts to apply equity in planning
In the first decade of the 2000s Metro remained the rail, bus, and highway agency it had already been for more than three decades. Metro’s 30-year (long-range) transportation planning (LRTP) document from 2009 reflects transportation officials’ continued rail building ambition. It also shows how relatively little investment and attention Metro pays to enhance walking and biking infrastructure, which enable basic human-powered mobility. Metro’s 2009 plan dedicates a mere one percent of the agency’s planned investments over 30 years to improve biking and walking linkages to transit (see 2009 LRTP, Figure F) — outspent twice over by ‘Administration and Other’ costs and thirteen times over by ‘Street and Road’ costs, which until recently have been designed with a singular focus: how to make it easier to drive a private automobile.
Source: Metro’s 2009 Long Range Transportation Plan, p. 15
The 2009 LRTP does not address nor ameliorate mobility disparities based on race and income. Although the 2009 plan includes a ‘job accessibility’ metric to show mobility disparities, Metro fails to address the implications of these disparaging metrics. The 2009 plan accepts weak outcomes like taking three decades to achieve small gains. For example, Figure 11 of the 2009 plan (copied below) shows that Metro will take 30 years to lower transit commute times to under an hour for a small additional (12 percentage point) share of transit dependent neighborhoods, which have mostly carless, low-income, or senior households. The 2009 plan ignores the remaining 41 percent of work trips from transit dependent neighborhoods that will take more than an hour by transit for, at least, another 30 years.
Source: Metro’s 2009 Long Range Transportation Plan, p. 54 (red underline added for emphasis)
Secondly, the same ‘Environmental Justice’ section of the 2009 plan overstates the positive impact the 2009-plan proposed projects could have on communities of color. For at least 30 more years (through 2040), around half of LA County’s African American, Hispanic, and Asian American ‘subgroups’ and around 70 percent of ‘non-Minority subgroups’ will remain over an hour away from work by transit — an outcome that reflects the need for transportation officials to focus more meaningfully on changing their relationship with policies that govern housing and job growth, which underlie people’s need to travel. Finally this 30-year plan focuses heavily on work trips largely sustaining difficulty for people whose access and independence relies on transit.
III. Broadening the agency’s engagement with local officials and advocates
In the current decade, Metro accounted for city-controlled infrastructure by committing Measure M funds to cities through two programs: the ‘Multiyear Subregional Program’ (MSP) and continuing the ‘Local Return’ program. Metro also lowers cities’ costs of applying for state transportation funds by assigning Metro staff to write grant proposals for cities. Metro offers this service, called Technical Assistance, to cities free-of-charge.
In the years leading up to 2016, Metro officials built a broad-based coalition that included local officials and advocates to campaign for a sales tax measure, which officials expect will raise $120 billion over 40 years for transportation purposes. Subsequently, Metro’s CEO convened a Policy Advisory Council to help develop the 2020-50 Long Range Transportation Plan “and other work plans and policy areas that the Metro Board may request.” When the measure passed, coalition members representing local jurisdictions, consumers, and other transportation providers gained seats on the Metro Policy Advisory Council (PAC). Members of the PAC’s ‘consumers’ constituency group especially advocate for social equity.
In 2018, Metro Board adopted a 10-year strategic plan (Vision 2028), which validates equity’s importance to fulfilling Metro’s mission. In the plan Metro commits to prioritize communities with need, but stops short of designating who in the agency would guide and how they would hold the agency accountable to its equity commitment. At a public meeting in February, Metro CEO Phil Washington alluded to hiring an officer to champion equity for Metro. We support this notion and urge Metro to hire a CERO – Chief Equity & Race Officer – with multiple staff to define equity and set performance measures, which reinforces all four pillars of the Equity Platform Framework and helps fulfill Vision 2028 strategic goals.
Also in 2018, Metro directors promised to prioritize investments to communities based on need by adopting the Equity Platform Framework. With the framework, Metro challenges its staff to approach every decision with the goal of achieving equitable outcomes countywide. Immediately, the framework should impact how Metro redesigns Metro’s bus network (NextGen), develops a 2020-50 Long Range Transportation Plan, deliberates which projects to accelerate, designs a congestion pricing program, and distributes Measure M’s Active Transportation Funds.
What’s next? Centering equity at the outset of every initiative
When Metro focuses on equity prospectively communities all over greater LA gain higher-quality access to more resources and opportunities.
—
A little over one year ago, Metro adopted a set of “pillars” to outline how Metro will transform its decision-making practices to center the needs of LA County’s most vulnerable communities. Anointed Metro’s “Equity Platform Framework,” the four pillars challenge all staff and board members to think differently as they fund, expand, and operate LA County’s main public transportation system. Every day, millions of people’s lives and livelihoods depend on the quality of Metro’s operations and investments. Whose lives in LA County will benefit in the coming years as Metro funds and expands LA’s transportation system depends on whether and how Metro staff and board members prioritize the needs of our most vulnerable communities.
Why does it matter that public agencies focus on equity?
Social equity differs from equality. Public officials who make choices with an equity mindset make choices fairly — they account for innate and socially-imposed differences that exist among communities. When public officials make decisions equitably, they resist the false assumptions that ‘all communities can equally access opportunity ’ (they can’t) and that ‘social differences among communities reflect fair decisions’ (they don’t). By Metro’s own data, just under half of transit dependent neighborhoods with mostly low-income, carless, or senior households in LA County will remain over an hour away from jobs by transit through 2040.
If Metro operates from an equity lens, and intentionally increases access in the areas that need it the most first, Metro can diminish persistent disparities and help overcome legacies of discriminatory public policy. Economic research shows that regions with low economic disparities and high racial inclusion have more thriving regional economies.
How can Metro implement equity today?
Step 1: Finalize and apply a regional definition of equity
A year after Metro adopted its first-ever Equity Platform, nearly 30 partners from all over the region stood up for equity implementation at Metro. In the past 12 months, Metro has started creating a methodology for a regional definition of equity and equity performance measures. But this work remains unfinished and transportation officials proceed making policy and funding decisions unconstrained by an equity framework.
“Define and Measure,” the first pillar in the Equity Platform, commits to “involve the diverse range of voices that must collaborate” on goals and metrics. A community-driven conversation on a regional definition of equity will also ensure that local priorities are met and protected. Local priorities include funding to sustain or expand local transit service, Vision Zero, first-last mile and complete streets, sidewalk and road repair and transit oriented communities.
Step 2: Establish an Office of Race & Equity with Chief Race & Equity Officer and team of staff
It was so exciting to hear Metro CEO Phil Washington publicly state that he intends to hire a Chief Equity Officer to shepherd Metro’s equity work. The monumental lift to build equity into Metro’s culture, governance, and investment decisions needs all the help it can get. Will Metro walk the walk and budget for an equity team? Good thing the annual budget process is here!
Step 3: Apply equity definition, performance measures, and community engagement to Metro’s annual budget, financing policies, public investments and programs, and capital projects
In January 2019 Metro launched an initiative named Reimagining LA County: Mobility, Equity, and the Environment to study traffic management tools that can alleviate vehicle traffic congestion and simultaneously generate additional transportation revenue. The two-year study will explore congestion (relief) pricing and charging fees for transportation companies who sell rides on the public right-of-way.
A congestion pricing scenario and/or transportation network company fees could revolutionize how Greater LA manages driving. It is imperative that a robust equity framework apply to these initiatives to prioritize and serve high-need communities, including low-income drivers.
But first, we need a regional definition of equity.
—
This post was initially published on March 13, 2019.
[This post was updated on April 4, 2019 to include the following recap of Metro’s latest decisions on two initiatives: Reimagining LA County (think: congestion pricing) and 28×28 (think: a project list).]
In late February we stood with nearly 30 equity partners to boldly call on the LA Metro Board of Directors to define equity and establish equity performance measures by May. In doing so, LA County’s main transportation agency would make progress on implementing their one year-old Equity Platform Framework, which sets the parameters to routinely achieve equitable outcomes countywide. We continue to urge Metro to integrate equitable decision-making in every aspect of their work — in funding, planning, building, operating, and maintaining LA County’s public transportation system.
Thank you to our partners who joined us to deliver an equity-centered comment letter on Metro’s Reimagining LA County initiative and testified before Metro (ACT-LA, Climate Resolve, ELACC, People for Mobility Justice, and SAJE). Here’s a brief update of what we’ve learned through mid-March.
1. LA Metro CEO, Phil Washington, intends to hire a Chief Equity Officer
In the CEO’s response to a Director’s question on succession planning for Metro’s equity leader, Mr. Washington said he intends to hire a Chief Equity Officer to shepherd LA Metro’s equity work, which Metro’s former Chief Planning Officer had focused on through the end of February.
Urge Metro to hire multiple full-time staffers to focus on equity — We realize that any single full-time staffer at LA Metro would be tasked with a profound duty of championing equitable decision-making in an agency authorized to fund, build, and operate public transportation for a diverse county of nearly 10 million people. Thus, in Metro’s upcoming budget deliberations, we will be calling on Metro to hire multiple full-time staffers to focus on equity.
Importantly, the board voted (1) to studycongestion pricing for two years, (2) to study imposing fees on ridehail and scooter companies, and (3) to prepare a detailed financial forecast by July to deliver 8 as-yet underfunded projects (prioritizing 4 of which are transit projects) on the 28×28 project list.
RE: Reimagining LA County
April 2019 – Staff to report to the full Board of Directors on how staff intends to complete the congestion pricing and new mobility fee studies, which alludes to what may be in both studies scope of work.
RE: 28×28
May 2019 – Staff to report to Executive Management and Construction Committees on progress toward a detailed financial forecast to deliver 8 big projects (prioritizing the 4 transit projects) by 2028, which is sooner than their project schedules in Measure M.
July 2019 – Staff to submit to the full Board of Directors a detailed financial forecast to deliver the 8 accelerated projects in the 28×28 project list.
3. The LA Metro Board attached four caveats to the Reimagining Initiative.
Motion 32.1 – another one of the four motions focused on the equity implications of congestion pricing on low-income drivers. In response, Metro staff broadened the scope of a proposed congestion pricing equity strategy to include more underserved communities than just low-income drivers. While these signals are positive, Metro staff must now define equity and its performance measures, while simultaneously authoring a potentially consequential congestion pricing report that could profoundly change travel behavior countywide.
As we continue our advocacy at Metro, we will be urging Metro to (1) establish and staff an Office of Race & Equity, (2) define equity and performance measures by Metro’s May board committee meetings, and (3) necessarily involve community stakeholders in crafting the congestion pricing report and its accompanying equity strategy.
Ever wonder why so many sidewalks in LA are broken, narrow, or missing altogether? Decades of government funding choices that have not prioritized the public right-of-way (sidewalks plus road space) underlie the issue (watch this). Ever wonder how to improve your local parks or libraries or street lights? When constituents earnestly call on their elected officials to step-up a specific public service or to fix broken infrastructure (including sidewalks), we hear public officials tell their constituents: “if it’s not in the budget, we can’t do it.” While budget allocations don’t always directly lead to real-time repairs, how cities decide to spend their annual budget does directly impact what residents and stakeholders can expect from their local government. In this way, the city’s annual budget reflects the city’s priorities for the upcoming fiscal year and highlights the boundaries of what city officials collectively believe they can accomplish.
City of LA Budget 101
The City of LA starts its fiscal year on July 1 and ends its fiscal year 12-months later on June 30. The City of LA’s annual budget, which the LA City Council and Mayor officially adopt in June, serves as the city’s spending and revenue plan for the upcoming fiscal year. A ‘FY20’ budget, for example, refers to a budget that starts in July 2019 and ends in June 2020.
The LA City Council is only one legislative body in the city to contribute to the budget, albeit the only body that deliberates budgets in a manner that is visible to the public. City department staff and staff representing the LA Mayor substantially contribute to the earliest iterations of the city’s budget before city councilmembers host their budget deliberations. By the time the City of LA’s 15 Councilmembers deliberate budget allocations in the spring, city department heads and staff representing the mayor’s office have already shaped the budget for several months.
Here’s a rough timeline showing how the City of LA budget is created and passed every year.
September to November: City department heads coordinate with Mayor’s staff — Each City of LA department estimates the total amount of funds they need for salaries and wages for their department’s staff, plus new and ongoing initiatives assigned to that department. Then each department General Manager sends to the Mayor’s office staff a proposed annual department budget.
November to April: City department heads deliberate with Mayor’s staff — City of LA department General Managers meet with Mayor’s office staff and the City Administrative Officer (CAO) to review their department’s proposed budget. The CAO is the financial advisor to the Mayor and City Council and assists in the preparation and administration of the city budget each year. These discussions form the foundation of the Mayor’s annual proposed budget and occur privately, outside the purview of the general public.
April: LA City Mayor’s State of the City address — At this annual public event, the Mayor of Los Angeles outlines the city’s priorities for the upcoming fiscal year and unveils the Mayor’s proposed budget. This address sets in motion the public-facing segment of city budget deliberations.
May: LA City Council Committee budget deliberations — LA City Council’s 5-member Budget and Finance committee hosts public hearings on the proposed budget for each of the city’s departments, which include the LA Department of Transportation and the LA Department of Public Works, for example. These hearings are hosted at City Hall and members of the public may attend, listen, and give timed public comment on any of the agenda items. The Budget and Finance committee chairperson has authority to schedule these hearings, determine the agendas, and set the allotted time for public comment. Agendas for these public hearings will list which department budgets will be reviewed. State law requires the city to publish agendas no less than 72 hours before each hearing.
June: LA City Council budget approval — LA City Council’s 15-member legislative body reviews the budget and adopts the budget by June 1. The new fiscal year starts on the first of July.
How can I get involved?
When engaging with any city’s policy, legislative, or budget process we recommend three basic steps:
1) Relationships are everything
Anyone who wishes to shape the city’s budget in a meaningful way might consider cultivating relationships at multiple levels within city government. Principle players who most influence the City of LA budget include: staff representing department general managers, staff from policy and budget teams of Office of the LA Mayor, and the five city councilmembers who serve on the LA City Council Budget and Finance committee.
(Important to note! While you may live in a district of a councilmember who is not on the Budget and Finance committee, as a member of the public you can still engage with other council offices on issues covered by the committees they sit on.)
2) Know your issues
If you wish to strengthen your “asks” to city officials to deliver a public service or infrastructure, consider accompanying your requests with recommended allocation of resources. Some questions you might study ahead of the ask might include: With what funds could the city pay for the initial ask? Who would maintain the service or infrastructure after it is launched? If the city should maintain any new infrastructure, then how will the city pay to maintain its upkeep? Have any other cities done something similar to what you are requesting? Anyone can rely on relationships during city budgeting and a working knowledge of public finance to strengthen their asks.
3) Show, more than tell
Our elected officials understand that they are representatives. When members of the public can demonstrate huge support or opposition to an issue, our policymakers are more likely to listen. Anyone can show that they represent the interests of many constituents through sign-on letters, large groups at public hearings, widespread social media campaigns, and other methods. We find that the most effective advocacy is to combine individual relationships with city officials with public shows of vast support.
What’s the possible impact? A Vision Zero case study
City of LA officials tout a $9.9 billion budget for the fiscal year ending June 2019. This massive city budget breaks down into numerous departmental budgets. Departmental budgets break down further to fund specific initiatives, such as the initiative to save lives that end in traffic crashes, referred to as Vision Zero.
Prioritization — In 2015, LA Mayor Eric Garcetti launched the Vision Zero initiative in Los Angeles. In response, the City of LA’s transportation department (LADOT) developed long-term Vision Zero planning documents that chart out a course to eliminate traffic deaths in LA by 2025 while pointing out the forbidding reality of streets in LA where “motor vehicle crashes are the leading cause of death of children between the ages of 5 and 14” (LADOT, 2017, p. 18).
Investment — During the city’s budgeting process, Vision Zero advocates and supportive elected officials leveraged LADOT-published planning documents to raise the spectre of funding for Vision Zero from $3 million to $27 million in FY18. This show of support was also influential to continue increases to Vision Zero funding to $37 million in FY19 — a 1,100% budget increase in three years. While this upward trending financial commitment to road safety is encouraging to every road user, physical changes to streets saves lives.
Implementation — So far, some of the City of LA’s most visible Vision Zero accomplishments have included installing diagonal crosswalks in Hollywood (2015), MacArthur Park (2017), and Venice (2018) — an intersection design type that studies show cuts pedestrian collisions by half. Based on a Vision Zero screening of streets for exceedingly high* occurrence of human fatality and injury, city officials have begun reshaping parts of Reseda Blvd. in the West San Fernando Valley, Roscoe Blvd. in the East San Fernando Valley, and five other Complete Street corridors whose present street conditions have often resulted in human tragedy.
* Vision Zero initiatives promote the notion that traffic crashes are entirely preventable and declare any human fatality by traffic crash as unacceptable.
City budgets reflect the city’s priorities for the upcoming fiscal year and highlight the boundaries of what city officials believe they can accomplish together. In order to influence public spending at the City of LA in a meaningful way, advocates can start by cultivating relationships at multiple levels of city government; matching their asks to city officials with funding source recommendations and proposed budgets; and showing support at budget hearings by building partnerships among allies and testifying at public hearings in the spring. The city’s budget cycle is active nearly all year round — starting with department managers and Mayor’s staff deliberations in the fall and ending with a City Council vote and Mayor approval in the spring (June 1). Once your desired initiatives appear in the budget, you and supporters can strengthen your appeal for change.
When Measure M was on the ballot almost three years ago, voters were told that its passage would help ease congestion in traffic-choked Los Angeles. Since its passage we’ve seen the unprecedented rail construction across the region, but still the average LA driver spends 100 hours stuck in traffic every year. What are some other solutions?
Congestion pricing is one traffic management tool. It uses price to incentivize would-be drivers to travel differently at busy times of day by charging actual drivers a fee for using certain routes. Just as gasoline prices go up before long weekends to prevent a gasoline shortage, traffic congestion prices would fluctuate to address high-demand — in this case, vehicle demand for road space. Case studies show that in addition to alleviating traffic, congestion pricing reduces greenhouse gas emissions and traffic crashes — a trifecta of important benefits for LA County.
Last December, LA Metro’s chief executive officer, Phil Washington, and his staff introduced the LA Metro Board to congestion pricing as a potential way to fill a $26 billion funding gap to complete a suite of 28 LA Metro projects that the LA Metro Board seeks to finish before the 2028 Olympics and Paralympic Games in LA. Last month, Mr. Washington and the LA Metro Board took a different approach and focused on the concept of charging drivers as one possible and very bold way to get rid of vehicle congestion in LA and possibly even fund free transit. Yet details on how that would happen are still being discussed.
Metro offers low-income drivers a one-time subsidy when enrolling in the ExpressLane program, if applicants are able to prove their eligibility. Metro also seeks to mitigate the health burden imposed on low-income communities situated next to freeways by committing proceeds of toll revenue to city active transportation and transit projects serving communities within three miles of the toll lanes. This last point is an important component to a successful congestion pricing model: investing in accessible and reliable transportation choices for people to get around without driving their car.
Cordon pricing — Drivers pay program operators a fee to drive into a designated area. Cordon pricing programs exist today in Singapore, London, and Stockholm. Cordon pricing models work when lots of drivers routinely enter a centralized (business) district with many transportation alternatives to driving. For instance, the Bay Area bridge tolls are a form of cordon pricing to enter San Francisco from other cities. Because jobs in LA are concentrated in numerous districts across the county, a cordon pricing model could be less appropriate in LA than other models. Downtown LA is the only jobs-rich area with many viable transit alternatives to driving. LA Metro estimates a cordon pricing program centered on downtown LA could generate up to $1.2 billion per year in revenue.
Source: Transport for London
Corridor pricing — Drivers pay program operators a fee to drive at a steady speed in any lane on a priced road corridor. LA ExpressLanes are a miniature version of a corridor pricing program. As with ExpressLanes, fees would be distance-based and time-based: digital signs present drivers with a cost to the next major exit when entering the facility (calculated behind the scenes by cost per mile) and electronically charge drivers once they pass sensors as they exit the facility. Because many road corridors become congested all over LA, a corridor pricing model, if implemented correctly, could present people in LA with impactful health and safety, among other, benefits. As the Metro research paper on this topic suggests, appropriate test corridors in LA could include portions of the I-101 freeway where it parallels the Metro Red Line and I-10 freeway where it parallels the Metro Expo Line. Agencies have not yet released revenue estimates for the corridor pricing model because too many variables remain undefined at this point in time.
Source: All Singapore Stuff
Vehicle miles traveled (VMT) pricing — Drivers pay road operators a fee to drive in excess of drivers’ allotted share of vehicle miles traveled. Agencies in California, Oregon, and Iowa have tested this model of pricing. Oregon’s test calculated the number of miles driven in a “congestion zone.” Although technology exists to implement this kind of pricing model, the model has not yet been implemented because of political challenges (Metro research paper). Because this model charges motorists according to miles driven independent of geography this model holds the greatest potential for alleviating traffic over a larger area. However, this model must thoughtfully consider land use and housing patterns in the region, as Los Angeles is increasingly seeing its more affordable places to live moving further away from job-rich areas. Revenue estimates for a region bigger than but principally including LA County reach as high as $10.35 billion per year. For comparison, Metro estimates Measure M generates $860 million in revenue per year.
What could congestion pricing accomplish?
Less traffic — Principally, the goal of congestion pricing is to alleviate chronic traffic on priced roads. As Metro’s congestion pricing primer paper states, traffic reduced by 20 percent in Singapore and 30 percent in London. In Stockholm, traffic reduced to 22 percent (down from 30-50 percent). As shown in LA Metro’s latest ExpressLanes performance report, drivers in LA’s ExpressLanes and bus riders who rode on the Metro’s Silver Line in the ExpressLanes traveled at speeds above LA Metro’s desired monthly average speed of 45 miles per hour.
Reduce air pollution — In addition to breaking-up vehicle congestion, congestion pricing could eliminate “elastic” vehicle trips that could be replaced by some other mode of travel. This lowers the total number of vehicle miles traveled, which reduces greenhouse gas emissions overall — a win for our planet and California’s legislative goals, to say the least. Over time, overwhelming driving (and parking) costs could incentivize widespread healthy, sustainable, and affordable living that seldomly requires car travel and hardly justifies car ownership.
Diminish disparities — Congestion pricing quickly and annually raises such large amounts of money that the revenue collected could transform how public agencies, including LA Metro, invest in transportation. When public agencies spend toll revenue in smart and equitable ways — by first spending on ways that improve transportation options in historically disinvested communities, people in the LA region as a whole enjoy more and higher-quality access to jobs, services, and life-enhancing opportunities. Public revenue raised by congestion pricing could be used to counteract decades of institutional neglect of vulnerable communities. At LA Metro, congestion pricing revenue could be used to do more than ask current staff to develop equity-informed recommendations to Metro Board. With Metro’s allocation of revenue raised by congestion pricing, Metro could hire equity-focused staff to teach and enforce equitable decision-making agency wide.
Criticisms
But to keep LA moving, we need viable and reliable alternatives to driving
True — successful implementation of any congestion pricing program requires prior and/or simultaneous implementation of viable transportation alternatives to driving alone. Congestion pricing models complement LA’s ongoing sales tax-funded initiatives. Congestion pricing models influence travelers demand for driving and its alternatives, including public transit. Meanwhile, LA’s sales tax-funded initiatives increase the supply of public transit service. Since over seven in ten people in Southern California “ride transit rarely or never, if one out of every four of those people replaced a single driving trip with a transit trip once every two weeks, annual ridership would grow by 96 million — more than compensating for the losses of recent years” (Manville, Taylor, and Blumenberg, 2018).
But would pricing roads divert traffic to other streets
Congestion pricing would serve as the incentive (on priced roads), while travel time on unpriced streets would simultaneously serve as the incentive (on unpriced roads) for drivers to travel differently. Drivers who might avoid priced roads by diverting onto unpriced roads might face long drive times that would themselves serve as an incentive to consider traveling differently.
But congestion pricing adds to the financial burden on low-income drivers
True — congestion pricing would add to drivers’ financial burden only if congestion pricing operators do not implementcountermeasures to subsidize low-income drivers’ access to priced roads. Congestion pricing subsidies would extend (to low-income people who drive) a moral minimum mobility benefit that American society currently denies low-income people by not subsidizing their gasoline taxes or any of the (at least 9) other regressive ways we pay for transportation. Utility companies such as LADWP make sure people can access utilities regardless of income with lifeline services that subsidize low-income households’ access to water and electrical power, for example. Research shows that automobile access is as essential as utilities are to sustaining a lifestyle that can overcome economic disparities. The vast majority of drivers who need to drive and have means to pay congestion prices can instead help to achieve equitable outcomes with congestion pricing.
Congestion pricing, again, is only one tool in the traffic management toolkit. Using money as an incentive to change behavior requires thought and intention. Charging a toll to drive poses a choice on the traveler per trip. But behavior can only change without penalty if viable alternatives exist. Congestion pricing is effective when travelers can access and afford (in both time and money) to take transit, ride a bike or scooter, carpool, walk, or something else. We support thoughtful and intentional traffic management tools that do not impose additional burdens onto people who already have the fewest transportation choices.
Next steps
Get involved — LA Metro Board members will deliberate whether to commission a 2-year study on implementing a congestion pricing pilot someplace in LA County at the following 3 board meetings. These public hearings will take place in the Metro Board Room at One Gateway Plaza, Los Angeles, CA 90012, 3rd Floor at the following times.
It is no secret that advocates across Los Angeles, both inside and outside of public agencies have been pushing for a regional definition of equity for a while now. But in 2019, a little over two years after Measure M was voted to be Los Angeles County’s fourth transportation sales tax and when a combination of Measure M and SB 1’s gas tax revenue will pour just under $2 billion every year into the Los Angeles region, we are due for equity implementation.
Why think regionally?
A regional definition of equity would do so many things. It would clear up the regularly-confused differences between “equity” and “equality.” It would highlight communities that have been historically underinvested in, resulting in socioeconomic barriers to resources and opportunities. And it would be a first step to a future Los Angeles where people from all backgrounds can afford to live, get to work and school, and enjoy a healthy quality of life.
But what we repeatedly heard at our 5th Policymakers Breakfast this week is that a regional definition of equity would also uplift the smaller, underresourced cities of Los Angeles County to better meet the needs of their constituents.
The “other 88”
Councilmembers representing cities across Greater Los Angeles, including Huntington Park,West Hollywood,South Gate,El Monte, and Culver City told us: their cities need support. With part-time, unpaid elected officials and minimal agency staff, these jurisdictions face huge hurdles with grant opportunities, project delivery, and community engagement. A regional definition and implementation of equity metrics to countywide investments and policies, would recognize the needs of these communities are just as important as the needs of larger jurisdictions.
Uplifting high-need communities across the Los Angeles region requires uplifting local cities. After all, many everyday issues that impact those with the fewest mobility options are all implemented at the local level: traffic safety, crosswalks and sidewalks, bus shelters and tree canopy, bike and bus lanes, and affordable housing policies. And community engagement is directly impactful at the local level.
Not only does the Equity Platform lay out the need for a regional definition of equity, but also includes: Build local government capacity serving historically underserved communities. That is exactly what we heard small cities asking for.
Otherwise, as Seleta Reynolds (General Manager of the Department of Transportation in the largest City in Los Angeles County) shared, “the gaps between large cities and small cities will continue to grow.”
Month 12
Last February, dozens of supporters and advocates of equity praised Metro for approving the agency’s first-ever Equity Platform. But where are we now, one year later?
There are several policies and initiatives across the County that we are tracking that would all be set on the right course by a regional definition of equity. Among them are :
We look forward to working further with all of our partners from across Greater Los Angeles on achieving a #JustGrowth region, where low economic disparities and high racial inclusion make an economically stronger and healthier region as a whole.
As you all may have noticed, LA is getting hotter and hotter. Literally. This is critical as we consider those travelers who are most vulnerable to rising temperatures, such as older adults and children, while they are walking, rolling, and waiting for the bus. However, there are currently challenges to getting more shade in the City of Los Angeles public right-of-way.
On August 27, Investing in Place held a conference call to provide partners updates and explainers on three City of Los Angeles public right-of-way issues:
Bus Shelters
#LASidewalks + Urban Tree Canopy
Potential merger of Bureau of Street Services and Department of Transportation
Bus Shelters
If you want to know the importance of a bus shelter, ask any bus rider what it’s like waiting for the bus. There arecurrently 1,870 bus shelters installed at Metro bus stops in the City of LA. This covers less than ¼ of all bus stops. There is a 20+ year history of why our bus shelters are so far behind in covering our needs here in sunny LA.
Here is a quick breakdown:
In 2001, the City of LA contracted with a private advertiser, Outfront / JCDecaux, to build and install bus shelters in exchange for an exclusive 20-year contract to advertise on select street furniture in the public right-of-way. The City, in turn, received bus shelters and other street furniture at minimal cost, a share of the ad revenue, and annual fees from JCDecaux.
In 2012, the City’s then-Controller, Wendy Greuel, conducted an audit that examined the City’s Street Furniture Program and the contract with Outfront / JCDecaux. In the first 10 years of the contract, JCDecaux implemented 710 total bus shelters (657 new / 53 replacement) compared to the projected delivery of 2,185 bus shelters (1,285 new / 900 replacement). The audit pointed to the Program’s arduous, 16-step approval process, which relies heavily on City Council Office approvals, as a primary contributor for why JCDecaux was unable to install the initial projected number of bus shelters.
Today in 2018, there are only a few years left on the contract. A renegotiation and possible contract extension to improve delivery of street furniture for the City is currently being considered by City Council. We will provide updates on those contract negotiations as they progress.
Next Steps:
Investing in Place is following the contract negotiations, which are currently in City Council committees, though have not been agendized for discussion in the near future. We are also considering outreach to individual Council Offices to discuss their vision for improved transit amenities in their District, particularly if the Street Furniture Program contract is amended.
#LASidewalks + Urban Tree Canopy
The City of LA has approximately 11,000 miles of sidewalks and estimates put those in need of repair at about 4,600 miles. As part of the largest Americans with Disabilities Act (ADA) mobility settlement in the country, the City of LA has launched a $1.4 billion sidewalk repair program.
This is great news for people walking and rolling on our City’s crosswalks and sidewalks. We want to see access to safe sidewalks coordinated with the retention of mature, lush trees to protect people walking and rolling from extreme urban heat. There is still a great need to discuss how a coordinated effort with shared goals lead to our streets, sidewalks, and crosswalks being safe, cool, and accessible for people using our public space. Many people may not realize this, but 11 separate City agencies are responsible for construction and maintenance in the City of LA public right-of-way. With that many cooks in the kitchen, it is easy to see why navigating our public right-of-way can be such a challenge.
The Sidewalk Repair Program has just completed its first fiscal year and here are some highlights for the Program:
Repaired 625,500 SF of sidewalk
Equivalent to approximately 24 miles
Constructed 671 curb ramps
Completed 115 Rebate Sites
Piloted Alternative Materials at 15 sites
Trees Removed: 460
Trees Planted: 791
A potential merger of the Bureau of Street Services and the Department of Transportation
Speaking of coordination and shared goals, in May 2018, Councilmembers submitted a Council motion to merge Bureau of Street Services (BSS) with the Department of Transportation (DOT). While these two departments are completely separate agencies with different leadership and oversight, many of their programs overlap. For example, if your car is parked on a street during street sweeping hours: DOT manages the parking restrictions but BSS manages the street sweeper. Similarly, DOT is the agency that designs and sites bike lanes, but BSS manages the crews that actually paint the lane lines in the street.
So how would merging these agencies affect the people of Los Angeles?
Investing in Place has written extensively on this issue:
We believe a citywide Capital Improvement Plan is one solution. A citywide Capital Improvement Plan, or “CIP”, would allow the City to identify projects and budget for years in advance, make the City more competitive to leverage other funds, such as County, State or Federal money. The City would also be able to better anticipate community education and engagement needs with a centralized list of projects. If community members know the proposed changes for their neighborhood in advance, they can more effectively engage with City departments and policymakers.
Next Steps:
Currently the motion is waiting to be heard in two Council committees: Public Works & Gang Reduction and Transportation. We want the City to seriously consider the benefits a CIP would bring and are interested in keeping this conversation going with any interested partners.
Background: A key task of Metro’s Policy Advisory Council (PAC), established in early 2017, was to review, comment and provide input on the Draft Measure M Master Guidelines. And from the June 2017 adopted Measure M Guidelines came a commitment to develop the implementation procedures for ten key Measure M funding pots – eight of which the PAC was to review, comment and provide input (see Measure M Guidelines Administrative Procedures Commitments chart here). The remaining Measure M administrative procedures still to be developed with the PAC are:
– Transit Multi‐Year Subregional Programs
– Subregional Equity Program
– Metro 2% Active Transportation
– 2% System Connectivity Projects (Highway Construction Subfund)
– 2% System Connectivity Projects (Transit Construction Subfund)
– Countywide Bus Rapid Transit Expansion
This blog post is focused on Metro 2% Active Transportation – estimated to invest over $85 million dollars in the next five years in walking, rolling and bicycling investments. And it is important to note that a large majority of Measure M funding for Active Transportation is administered by the COGs in the Multiyear Subregional Programs.
—————————————————————————————————————————–
Developing the first regional fund for active transportation is no easy feat. Per Metro data, 87 percent of Metro Bus and 64 percent of Metro Rail customers arrive at their station or stop by walking, biking, or rolling. And so the Metro 2% Active Transportation Program (ATP) fund that could potentially be used for sidewalks, crosswalks, and Vision Zero is especially important. A strategic vision is essential to address these needs and leverage this new and critical regional funding (luckily Metro the Active Transportation Strategic Plan adopted in 2016!).
Metro staff has now conducted two 2% ATP PAC work groups (April and July), presented multiple updates to the full PAC (March, May, and June), and shared how Measure M ATP 2% has been budgeted to date. It is Metro’s fiduciary responsibility to move investments forward, but we want to see these budgetary decisions clearly aligned with existing Metro policies (such as the Active Transportation Strategic Plan). We believe this will contribute to a more deliberate and meaningful investment strategy that will yield better transportation options for all.
In an effort to increase transparency and allow stakeholders to weigh in, CEO authorization of 2% ATP has been extended from its original timeline of June 2018 to later this Fall. This gives Metro and engaged stakeholders more time to address outstanding questions from PAC work group and full meetings:
Remaining PAC Working Group Key Questions
What qualifies as a “regional priority?”
How is funding being prioritized? How does Metro’s Equity Framework inform this program funding prioritization?
What are the opportunities for Board staff/non-PAC members to weigh in on the ATP 2% guidelines?
Metro Bike Share
What is the total cost of Metro Bike Share Program?
How has Metro Bike Share been funded in the past?
If funding from Metro Bike Share is removed from Measure M ATP funding (OMB has $23 million going towards it in the next 5 years in their cash flow recommendations) what other funding can be leveraged to keep Metro’s Bike Share Program fully funded?
Metro Bicycle and Pedestrian Programs
What specific programs does this program include?
How was it being paid for before?
Per Metro staff, they are still working on the following:
How do allocations to projects/programs within the subfund get made (decision making process and transparency)?
What are the specific eligibility requirements (especially related to capital/operations/programming)?
Metro staff set a goal to schedule an August 2% ATP PAC work group meeting to draft Measure M ATP 2% guidelines, which will then be presented at the September 11th Metro full PAC meeting. The Metro PAC will then have 30 days to review, comment and provide input.
In the meantime, we’d like to be proactive and have conversations with partners about what equitable and feasible guidelines they want to see for this fund. We invite interested folks to join our #JustGrowth conference call on August 28 at 11:30a to share their thoughts on how to best invest Measure M funding for first/last mile improvements, sidewalks, crosswalks, Vision Zero, and even Metro bus service, including dedicated bus lanes. To join the call or to learn more about getting involved, email me:amanda@investinginplace.org
Our key message here: In order for the LA Region to re-dedicate itself to fundamentals like bus speed and, most importantly, reducing how long you wait for a bus to arrive, will require increasing investments in bus operations.
By now, everyone admits that Metro has a problem. People aren’t riding buses like they used to. Metro’s bus network drew an average of 887,000 daily boardings during the agency’s 2018 budget year, 22% fewer than it did in 2014.
Losses of such magnitude have cast doubt on the possibility of a transit revolution taking root in Los Angeles, even as nearly all of our region’s goals – from the city’s Mobility Plan 2035 to the state’s greenhouse gas reduction targets to CEO Phil Washington’s own stated ambition to get a quarter of county residents onto transit – depend on the occurrence of such an epochal shift.
The bus and rail networks cannot meaningfully be separated. They make up one interdependent system, and that system won’t be a success until bus service can once again earn riders’ time, money, and loyalty.
So… where to begin? Metro recently released its Vision 2028 Plan to lay out a widescreen view of what the Los Angeles of the near future could look like. In the next year, the agency will also wrap up its NextGen Bus Study, which will suggest comprehensive changes designed to maximize network efficiency.
But, so far, despite some encouraging signs (for instance, a focus on enforcing transit-only lanes), most of the evidence suggests that Metro is seeking to rebrand its core transit service, when what it really needs is to re-dedicate itself to fundamentals like bus speed and, most importantly, frequency.
Angelenos have signaled their belief in the importance of a robust transportation network by voting for multiple sales taxes to support Metro, but, to compete with the status quo, transit has to be able to offer something more than long waits at unsheltered bus stops for trips that take more than twice as long as a single occupancy vehicle.
What’s more, Metro has not made more than minor adjustments to bus service and has expressed an intention to hold service hours mostly flat for years. On the surface, this is not a recipe for getting Angelenos to embrace transit, but, in fact, it’s even worse than it seems. As congestion has increased in the years since the recession, buses have slowed down, turning every year without an increase in service hours into a de facto service cut.
It is understandable that Metro wants to get more for its operations money, and that it is frustrated with cities have fought against new bus-only lanes, but they have to find a way to make higher frequency service work. If Los Angeles is ever to have the transit network its residents want, Metro needs to learn that frequency is not a dirty word.
Metro is underway in their NextGen Bus Study to propose a redesign of the entire Los Angeles County Bus Network. NextGen marks the first time in 25 years that Metro will comprehensively re-examine the service it provides, even down to fundamentally rethinking what public transportation can and should be in the 21st century. It is expected the findings from this study will lead to launching a new bus network in the Fall of 2019.
While technology does provide opportunities for the transit sector to better tailor the experience of riding public transportation to the changing expectations of an increasingly-connected world, one thing that hasn’t changed in 2018 is that the quality of bus service will determine how people feel about going Metro.
Over the past 5 years, that quality has been trending downward. Since 2013, Metro’s average bus speed has declined by 15%. Meanwhile, today, rapid buses, originally envisioned as a stepping stone to Bus Rapid Transit, are on time just 66% of the time. As might be expected, average daily boardings have also fallen over the same period, as passengers seek faster and more reliable rides. The bus network carries 20% fewer riders today than it did in 2014.
Achieving NextGen’s goal of reinvigorating Metro’s ridership will require going beyond cosmetic measures like redesigning individual bus lines and marginal adjustments to frequencies. Metro needs to show riders that buses can be trusted to get them where they’re going in a reasonable amount of time. Given where the starting point is – a Metro presentation this month announced that nearly 80% of bus trips originating in the downtown area took at least twice as long as the same trip by car – any substantial solution must find a way to incorporate bus-only lanes on a greater number of LA’s streets.
Bus-only lanes are not a new concept in LA. The original El Monte Busway along the 10 freeway opened in the 1970s. But since then finding the political will to build and maintain high-quality bus lanes has been a halting process. Metro doesn’t have authority over what happens on city streets. The layout of the county, with its many interwoven municipalities, makes coordinating bus lanes along lengthy corridors a daunting challenge.
Take the example of Wilshire, for example. LA’s iconic thoroughfare from downtown Los Angeles to Santa Monica hosts the region’s busiest bus lines, and, on part of its length, it also has bus-only lanes. But the effectiveness of those lanes has been hindered by the refusal of specific cities and neighborhoods to allow transit-only lanes in their communities.
The lanes stop abruptly in Beverly Hills, Westwood, and Santa Monica, leaving buses stuck in some of the county’s worst traffic, and potentially wiping out the increased speed that they could be achieving by traveling in dedicated lanes. As one of the county’s largest distributors of tax revenue, Metro needs to be willing to use the substantial leverage it has at its disposal to encourage cities to accept bus-only lanes.
Design also plays a major role in the success of a bus-only lane. Using Wilshire again as an example, buses occupy the rightmost traffic lane, leading to frequent conflicts with backed up lines of cars turning right. In general, bus-only lanes should seek to separate buses from the movements of single occupancy vehicles as much as possible. On mixed traffic roads, that means giving buses the center lanes, allowing them to avoid delays. Having center-running bus lanes requires a greater commitment from Metro and the cities, as it necessitates providing some space for passengers to get on and off the bus safely on a platform in the center of the street. But this type of investment is what should be considered normal on LA’s most heavily traveled transit corridors – which are also the ones that experience the most significant traffic delay.
Design and corridor choice are only part of the battle for high-quality bus-only lanes. The continued effectiveness of these lanes relies on active management by Metro, largely boiling down to the enforcement that accompanies them. People driving single occupancy vehicles, as CEO Phil Washington noted on his way to a recent Dodgers game, can often be found in bus-only lanes, leading to traffic jams that negate the investment and scare riders away.
Transit-only lanes need to be clearly marked, and an expectation should be set that only authorized vehicles will be allowed to use the lanes. This type of enforcement, which focuses on improving the speed of a bus ride rather than on monitoring riders, should be a greater point of emphasis in Metro’s bus system.
Expanding bus lanes has never been an easy proposition. But the breadth of the responsibility that Los Angeles voters have placed in Metro’s hands, a sweeping mandate to expand transit use, reduce traffic, and improve the sustainability of our region, demands difficult action be taken. It is time for the LA Region to get serious about bus lanes.
Yesterday at the LA City Council meeting a motion was introduced to create a phased action plan to implement a merger of the Bureau of Street Services (BSS) with the Department of Transportation (DOT). The motion represents a step forward to begin efforts to better coordinate and improve how the City of LA manages its public right of way.
Next steps will be for this proposal to be assigned to committee and the Chief Legislative Analyst (CAO) office to develop a plan and present for discussion. Interested in this discussion and want to track it? We will be posting about it but we encourage you to sign up for updates to Council File 18-0458 (click on the little envelope at the top to sign up).
You know what music is to the ears of active transportation advocates? Active transportation funding. Without dedicated funding, how can we build healthy communities where all people have safe and convenient transportation choices?
When Measure M was passed by voters in 2016, ensuring a $122 billion funding source for transportation investments across Greater Los Angeles, it marked the first countywide transportation sales-tax that specifically dedicated funding for active transportation!
But in a $122 billion expenditure plan that includes transit and highway construction, goods movement, transit operations, state of good repair (maintenance), and local return, where do we find the funds set aside for walking and rolling?
Show me the money
One of the Measure M programs that specifically funds active transportation is the 2% Active Transportation program (or 2% ATP). (Not to be confused with the State’s ATP fund!)
Image courtesy of: Los Angeles County Bicycle Coalition
2% ATP is estimated to generate approximately $17 million per year from Measure M. Program details are currently being developed by Metro, but objectives and eligible uses have been established.
Objectives:
Expand multi-modal connectivity
Improve the regional active transportation network
Eligible uses:
Active transportation and other capital that achieve 2% ATP objectives
First/last mile components of major capital projects listed in the 2016 Measure M Expenditure Plan
Note: The only eligible 2% ATP project currently listed in the adopted Measure M Guidelines is the LA River Waterway and Bike Path
Two existing policies that will guide the development of 2% ATP are the Metro Active Transportation Strategic Plan (ATSP) and Vision Zero. These are critical frameworks that will shape the program’s planning and emphasis on safety.
Planning: Countywide funding needs for active transportation are huge. When Metro adopted the ATSP in 2016, staff estimated the cost of funding Countywide annual active transportation needs at low end of $737M and high end of $1.7B.
Safety: The adopted Measure M Guidelines direct projects funded through Measure M to “support the protection of pedestrian and bicycle safety in parallel with Vision Zero or equivalent policies.” While the greater region currently lacks a countywide Vision Zero policy, it is crucial that traffic safety is a priority for active transportation investments.
It is important to note that 2% ATP is not intended to be a standalone funding source for countywide active transportation needs and programs. Metro envisions this pot of Measure M funds as matching grant program for external funding opportunities (such as statewide ATP), and a competitive fund for regional active transportation projects.
Wait, can you show me more money?
Let’s recap:
2% ATP is estimated to generate approximately $17 million annually for the entire region
Metro’s own ATSP estimate of regional active transportation needs total $737 million annually (on the low end) and up to $1.7 billion
2% ATP is not intended to be a standalone funding source for active transportation projects
While 2% ATP is a step forward in identifying the health and safety needs for Greater Los Angeles that can be addressed through active transportation improvements, it clearly is not enough money to meet the identified countywide need. Fortunately, it is not the only source of active transportation funding in Measure M.
We have written about the $10 billion Multi-year Subregional Programs (MSP) in Measure M. Part of why we care so much is that is comprises the largest amount of dedicated funding for first/last mile, sidewalks, bicycle infrastructure, and safe routes to school in Measure M. For further explanation of the difference between 2% ATP and MSP, check out our March 6 #JustGrowth webinar (slides).
Since 2% ATP is eligible for matching funds, it will be critical to strategically leverage these limited dollars with other funding opportunities to most efficiently improve the health and safety of our entire region.
What’s next?
Metro staff is currently finalizing draft guidelines for 2% ATP. On April 5, Metro will be hosting a 2% ATP working group open to members of the Metro Policy Advisory Council (PAC) to further refine these guidelines. See the 2% ATP guidelines process below.
On April 4, Investing in Place will be hosting an open planning call with our #JustGrowth participants, and other interested parties, to weigh in on the development of 2% ATP guidelines, prior to the April 5 PAC working group. We are particularly excited to further develop the prioritization criteria for any 2% ATP competitive funds.
For those interested in getting more involved in the MSP process, this is managed by the County’s nine subregions or COGs.
Close your eyes and picture the last minivan commercial you saw. You may remember seeing a cleancut, youngish, but not too hip woman, handling life with ease behind the wheel. And that’s because our societal culture (and mainstream marketing) assumes, encourages, and expects women to be the primary members of the household that are running errands (trunk space!), managing kids’ travel needs (safety!), and making more trips because of it (mileage!).
And more often than not, this is true.
Of the few data points available for how women in the U.S. and Los Angeles travel, we know this: Women travel in similar modes than men, but travel shorter distances and make more trips. Women, particularly low-wage and shift workers, are also more likely to travel during off-peak hours (outside of the morning and evening “rush hour” periods). And minivan commercials aside, women are also more likely to use public transportation.
So why isn’t our transportation system better designed for half the population, who are making more trips?
Transportation is a Women’s Issue
Three panelists discussed these very issues at a March 7 panel, “Transportation is a Women’s Issue,” hosted by UCLA Institute of Transportation Studies. Los Angeles Department of Transportation (LADOT) General Manager Seleta Reynolds, Metro Deputy Executive Officer Stephanie Wiggins, and UCLA Luskin urban planning professor Dr. Evelyn Blumenberg are all transportation leaders in their fields of public agencies and academia.
Just having an all-female panel on transportation planning is exciting. Transportation planning and engineering is a traditionally male-dominated field and, like most fields, implementation tends to reflect the perspectives of those in the position of making decisions. Even within transportation advocacy, particularly bicycle advocacy, the dominant perspectives have traditionally been from white men.
“Planning has always been gender-neutral, but what isn’t measured gets lost.” – Stephanie Wiggins
Panelists discussed three primary challenges to shifting this application: lack of comprehensive data (and lack of using available data) that reflects travel patterns outside of the 9a-5p two-way weekday commute; industry-wide funding and performance measures focused on the travel “peak” (morning and evening weekday rush hours); and, especially in Los Angeles, the types of trips that women tend to take are still best served by car.
“If what you are solving for is the peak, the peak, the peak, then you’re never going to have a system that has reliable, frequent, comfortable service at the times of day when women need it the most.” – Seleta Reynolds
We also see anecdotally and in limited data available, that parenthood impacts women’s professional and travel patterns more significantly than men. While we increasingly see women in the workforce, we still see traditional gender splits in different-sex parental households. Women tend to remain the primary caregivers, both inside the home and for outside travel such as school/child care, appointments, activities, and household errands.
“The share of women in the labor market has dramatically increased, but women are also still responsible for much of the unpaid labor associated with household tasks – and it’s difficult to accomplish both with transit” – Dr. Evelyn Blumenberg
Panelists also discussed the need to address safety, both actual and perceived, when designing transportation systems that serve women. Sexual harassment, system and physical design, and off-peak transit service were discussed as important lenses through which to update how we look at our transportation systems.
To view video of the whole panel, please click here.
A Better System for All
So where does this leave our minivan-driving moms? And more importantly, what about our many moms who are getting to work, school, doctors, and soccer games without a car?
We can start with our goals.
If we continue to prioritize our transportation system improvements based on commute patterns, we are missing the needs of a majority of our system users. Dr. Blumenberg reported that only 16 percent of total trips are work commutes. Let’s think about shifting our transportation goals from solely reducing peak hour congestion to equitable outcomes for all system users. Not only will this serve our drivers, riders, rollers, and walkers who need it most, but will also create a more effective and efficient system that can potentially improve regional economies and public health by easing the burdens of travel that are disproportionately shouldered by women.
Then let’s get the data that informs these goals. What are the travel patterns we see in women and female parents? What are the needs? Who is asking women what they (really) want? During the UCLA panel, Stephanie Wiggins talked about Metro’s upcoming NextGen redesign of the Countywide bus network–and how the team was originally all male. She changed that.
It is important to support women leaders in transportation planning, just as it is important to listen to women consumers of our transportation systems. There exists both quantitative and qualitative evidence for a new way of planning and investing in our transportation systems. Investing in Place continues to work with our grassroots partners to amplify these qualitative perspectives through storytelling videos. We look forward to sharing these stories in the coming months.
Last month, Investing in Place analyzed the Tier 1 recommendations from the City of Los Angeles FUSE report. This post analyzes the report’s remaining Tier 2 and 3 recommendations. And contains movie spoilers.
************
When Danny Ocean decided it was a great idea to simultaneously rob three Las Vegas casinos in the film Ocean’s Eleven, he had a vision. He knew what he wanted to do, but more importantly he knew how to make that vision a reality. His first step? Find an implementer. His friend Rusty Ryan was the guy who got things done and who helped form the rest of the team of eleven “contractors” that would eventually pull off a triple heist totaling $150 million cash. (Sorry but you have had many years to watch multiple versions of this movie.)
Let’s take the Ocean’s Eleven method and apply it to the Tier 2 and 3 recommendations from the FUSE report released last fall by the City of Los Angeles City Administrative Officer (CAO). (These recommendations are listed at the end of this post.)
The recommendations envision a more coordinated City where agencies work together efficiently, ensuring residents receive seamless and responsive services. Many of the recommendations are common sense, such as enhancing customer service options on LA311 or encouraging knowledge transfer between veteran staff and new hires. They are much more logical than robbing several vaulted and secure casinos. So why haven’t they happened?
Not our First Rodeo
While heavily-researched, the FUSE report recommendations are not the first time strong ideas have surfaced for how to improve the City’s infrastructure operations.
In 2013 Councilmember Bob Blumenfield introduced a motion directing the City to create a Capital Infrastructure Strategic Plan. The motion directed the City to prioritize projects, identify funding, create mapping tools, and facilitate public transparency. As part of the motion, the CAO committed to an interdepartmental working group to develop this plan.
Also starting in 2013, Councilmembers Joe Buscaino and Mitch Englander championed “Save Our Streets LA”, a $3 billion bond-turned-sales tax ballot measure to fund emergency street repairs. This proposal didn’t gain enough traction for a 2014 vote, but brought renewed awareness to the dire conditions of so many Los Angeles streets.
The puzzle remains in Los Angeles: it is not the “what” but the “how” to make this City better.
As we discussed in our Tier 1 recommendations analysis, we can all agree on the problems. The City struggles with interdepartmental coordination while information and decision-making remains very decentralized. This leads to a City with considerable need to improve the public right-of-way (leads nation in traffic deaths, 4,600 miles of inaccessible sidewalks, 8,200 miles of roadway in disrepair, etc.) with little proof it is ready to implement projects and services to address this need.
So…What’s the Plan? Los Angeles has the vision: a safe and thriving City where the public right-of-way serves people of all ages, abilities, and modes of travel. We have the team: talented infrastructure agency leadership and a seasoned workforce of project managers and engineers. Where do we go from here?
The FUSE report recommendation we are most excited about is the reinstitution of a citywide Capital Improvement Plan (CIP), Rec 2.5. Los Angeles is the only major City in the country that currently lacks a citywide capital plan. While a capital plan for all City assets could include other public facilities, including parks, libraries, or City-owned vacant lots, we can start with a multi-year plan and budget for our public right-of-way.
We don’t have the final answers on that. But we are ready to get to work on a solution. And we see many partners who want to dig into this issue: community leaders, policymakers, and public agency staff. The City of Los Angeles has great ideas already, we just need to come together with a plan to rob the casino implement them and build the better City we all envision.
LA City Council Public Works & Gang Reduction Committee will be discussing the Tier 2 and 3 recommendations today (agenda item #2): Wednesday February 7 at 1p in the Board of Public Works Room 350 at City Hall.
For a full list of Tier 2 and 3 recommendations, please see below or view pages 128-129 of the FUSE report.
************
Tier 2 Recommendations: Improvements to Infrastructure Support Systems
– Rec 2.1: Strengthen oversight over underground activities, optimize time-related street activities, strengthen City paving plans, preserve City street investments, and provide transparency to City partners, utility providers and the public by converting utility coordination from a manual process to an electronic system
– Rec 2.2: Address lack of asset data, timing of maintenance activities, selection of appropriate preventative and deferred maintenance lifecycle activities and scheduling for asset upgrades by prioritizing strategic asset management activities across asset classes
– Rec 2.3: Resolve consistent customer issues with closed status messaging, streamline intake process and ease of use, and provide better transparency tools by making enhancements to the LA311 Customer Relationship Management (CRM) system
– Rec 2.4: Present taxpayer investments in the City’s street network by updating policies affecting street protections that could include establishment of a moratorium for newly reconstructed streets and a new Concrete Street Damage Restoration Fee – Rec 2.5: Establish guidelines for large, critical infrastructure investments by reinstituting a citywide Capital Improvement Plan – Rec 2.6: Bolster proper oversight and direct better allocation of resources to prevent multiple agencies from maintaining the same asset or program by clarifying Bureau and department roles in overlapping programs
Tier 3 Recommendations: Improvements to Specific Infrastructure Programs
– Rec 3.1: Strengthen the city’s overall street network by updating the methodology for resurfacing and slurry seal programs to employ factors beyond the PCI score to prioritize paving and maintenance projects – Rec 3.2: Support succession planning, skills development, effective program management and best in class customer service by encouraging knowledge transfer and cross-pollination of process expertise across Bureaus/departments and offering regular training regimens to employees and leaders – Rec 3.3: Promote transparency with utility partners and the public by posting the entire projected annual resurfacing plan online with monthly updates of work completion in a user friendly format – Rec 3.4: Support timely and quality project delivery within Department of Public Works by streamlining contract processing time and strengthening contract language to consistently include performance metrics – Rec 3.5: : Improve quality trench work by supporting permittees in assessing the performance of their subcontractors, educating them on city standards, noncompliant work and timeliness of repairs as indicated on the permit
Source: “Evaluation of the State of Street Related Infrastructure Programs in Los Angeles” written by FUSE fellow Laila Alequresh and released by the office of Los Angeles City Administrative Officer (CAO).
The following post summarizes a portion of a CAO FUSE fellow report released last month that recommends ways to improve infrastructure agencies operations and services in the City of Los Angeles. This post also includes our initial reactions to the report’s most impactful “Tier 1” recommendations: a) relocating the Los Angeles Department of Transportation (LADOT) into the Department of Public Works (DPW), and b) creating a citywide Office of Infrastructure Management. We will share similar posts analyzing the report’s Tier 2 and Tier 3 recommendations shortly.
Have you ever seen this image of the Los Angeles street and sidewalk — and the mosaic of different City agencies that are responsible for the different parts? (Hint: we blogged about it earlier this month!)
This image may not matter much–until you need to get a pothole repaired, or a crosswalk or bus shelter installed, or a broken sidewalk fixed. Then what do you do? And when will it happen? Will it happen at all?
We need to Stop Trippin’
It is not a secret that the City of Los Angeles struggles with project delivery of basic infrastructure maintenance and repairs. Our current Mayor Eric Garcetti successfully campaigned on prioritizing “back-to-basics” maintenance before being elected in 2013. In 2015 the City settled a $1.4 billion class action lawsuit, known as the “Willits settlement,” because Los Angeles sidewalks were found to be not compliant with Americans with Disabilities Act (ADA) guidelines. And in a report shared last month by the City’s Chief Administrative Officer (CAO), a constituent survey found that residents gave City delivery of public works services (including sidewalk and street repair) a score of 3.5 out of 10.
This report, “Evaluation of the State of Street Related Infrastructure Programs in Los Angeles,” written by FUSE fellow Laila Alequresh, is well-researched with strong historical context. Its key finding could be summed up in that image of the Los Angeles sidewalk and street above: so many City agencies influence each part of our public rights-of-way and infrastructure. However, these agencies do not operate from shared visions/missions and coordinated work plans. The City’s inability to keep up with basic maintenance issues on sidewalks and streets is especially challenging given that residents and Business Improvement Districts (BIDs) rank sidewalk repair as the city service needing most improvementin the report’s surveys.
This is an exciting first step. The City of Los Angeles needs to reassess and refine how our public rights-of-way are managed, maintained, and improved. The current practice of excluding sidewalks and crosswalks from broader transportation and mobility planning removes the walking/rolling experience from our new Los Angeles transportation revolution. So what now?
If we all agree on the problem, what is the solution?
The FUSE report identifies the need for improved coordination and communication between the City’s seven infrastructure agencies: Department of Transportation (DOT); Department of Water & Power (DWP); and the Department of Public Works (DPW), comprised of five Bureaus, Contract Administration (BCA) Engineering (BOE), Sanitation (BOS), Street Lighting (BSL), and Street Services (BSS). Based on employee surveys, the report found a “universal belief that better planning and coordination across Bureau siloes and beyond is absolutely necessary.”
The report proposes two “Tier 1” recommendations, which are ranked highest of all report recommendations on a scale of impact, cost, and longevity:
Move DOT under the Department of Public Works as a sixth Bureau.
Create an Office of Infrastructure Management (OIM) within the Board of Public Works
The primary idea supporting the Tier 1 recommendations is that by transferring all street-related agencies under the same governing body, different transportation and infrastructure services and projects will benefit from improved coordination and communication, which will lead to better delivery of city services for constituents.
People who make music together cannot be enemies (at least while the music lasts)
On paper, these recommendations make sense. Logically, the various agencies that work on streets and sidewalks should be housed in the same administrative body. As the report states, this should lead to better projects and delivery of services.
However, this logic only applies if the inter-bureau coordination and communication of the current Public Works Bureaus work well together toward shared missions. The report quotes current Public Works employees who point to competition, rather than collaboration, between Bureaus. Nearly all existing conditions research in the report demonstrates that there is much-needed improvement to achieve streamlined, successful coordination between the Public Works Bureaus.
What if someone had suggested Justin Bieber join the boy band One Direction? Both the solo artist and the group dominated pop charts and enjoyed fans from similar demographics. But, as we saw One Direction disband in recent years, there is also a strong logic that any group needs a strong foundation before adding a new member.
We are not convinced that the Tier 1 recommendation of moving the entire Department of Transportation into the Public Works as a sixth Bureau will solve the report’s identified problems of misaligned missions and uncoordinated project delivery. As a standalone department, DOT has a different culture of managing and delivering projects than the Public Works Bureaus. And the current lack of coordination within existing Public Works Bureaus does not reflect an existing best practice of interagency coordination and streamlined communication. The report does not demonstrate any evidence as to why this restructuring would assuredly lead to better interagency infrastructure coordination.
Also important, DOT is the City leader in mobility and safety, pushing Mayor Eric Garcetti’s Executive Directive #10 and departmental priority Vision Zero: the goal of reducing traffic fatalities to zero by 2025. However, safety for all road users has not currently proven to be a top priority for Public Works Bureaus. A focus on safety and street design’s impact on our lives is also not highlighted in the FUSE report, which focuses almost exclusively on needed maintenance and repairs. For instance, the report rightly points out that infrastructure services should be based on residents’ needs, not grant opportunities. But responding to residents’ maintenance needs requires different systems and planning than designing a 7,500-mile street network (and 11,000 miles of sidewalks) for saving lives. What happens when the leading voice to reduce traffic fatalities in Los Angeles is tucked into a six-Bureau entity that has not demonstrated a similar commitment to safety?
Before approving a major interagency restructuring, which would have a huge citywide administrative and budgetary impact, we recommend identifying more concrete evidence and proven strategies to improve coordination between the seven City infrastructure Departments and Bureaus.
Why buy when we can (potentially) fix?
The second Tier 1 recommendation proposes creating an Office of Infrastructure Management (OIM), housed in the Board of Public Works (BPW), the 5-member commission with governing authority over the Public Works Bureaus. The proposed OIM could potentially serve as a much-needed connecting body between the various infrastructure agencies’ work plans, missions, and projects. This also seems like an ambitious City restructuring requiring amending the City Administrative Code with little evidence of why this would work better than the existing BPW alone. Without intentional and strategic leadership input from all impacted infrastructure agencies, it is possible that this proposed office could become an additional bureaucratic hurdle staffed by City employees who are not authorized to make broader policy decisions or recommendations.
As discussed above, “infrastructure” issues like sidewalks and street furniture are routinely separated from “mobility and transportation” safety planning, even though these are critical components to the path of travel for people walking and rolling. And the report uses the example of the City’s 2015-adopted General Plan mobility element, Mobility Plan 2035,never being vetted by the Board of Public Works or Public Works Council Committee. We ask if there are incremental and measured steps to address this disconnect in place of creating a new office.
The report points out the absence of a citywide capital expenditure plan in Los Angeles. Departments and bureaus have their own plans, but these are also not always coordinated. As a potential first step, the BPW Commissioners might oversee development of a 5-year citywide coordinated capital expenditure plan (we see you, Tier 2!). It may also be worth exploring if relevant staff from the Department of City Planning (DCP) who track transportation-related grant opportunities should be included in this work.
Aligning efforts to increase coordination and accountability for projects in the right-of-way may also present opportunities to shift specific programs and tasks between agencies. We also recommend a further assessment of the infrastructure agency work plans to identify programs that may make sense to restructure. Revising agency work plans could potentially deliver a higher return on efficiency and less administrative and budget impacts than moving entire departments.
Let’s fix our right-of-way the right way
The FUSE report is a significant unveiling of our City’s inter-agency challenges and proposes recommendations that intend to address these challenges. It is a critical for the City of Los Angeles to address these challenges soon, particularly with new local and statewide transportation funding and infrastructure opportunities.
The report rightly identifies the need for better coordination and an oversight entity for street-related projects. However, practical and cost-effective improvements—such as a comprehensive infrastructure plan that integrates DOT, Public Works, and other agencies managing the streets—may offer a more feasible path forward.
The Tier 1 recommendations are identified as large in scale, impact, and potential in cost. We ask: do they have to be? We ask: are these the right moves?
We look forward to seeing this report discussed further by the City in 2018 and will share our further analysis of the Tier 2 and Tier 3 recommendations of the report shortly.
The following post is in response to a report issued by the CAO that will be presented to the Public Works and Gang Reduction City Council committee on 12/6/17 at 1pm.
My street needs fixing. Now what?
Have you ever wondered how to get your sidewalk repaired in the City of Los Angeles? Or how to get a new crosswalk painted? Or get a street tree planted? Many people may not know: each of these city services is currently available–but through three separate and autonomous city agencies.
Our built environment has a direct impact on public health, safety, and opportunity. We rely on public infrastructure to get to daily destinations like work, school, places of worship, medical appointments, and seeing our friends and family. The maintenance and service delivery of our public infrastructure shape the quality of life of city residents.
Source: 2017 DIY Great Streets Manual, Mayor’s Office
So who do I call for street repairs and maintenance?
In an effort to demonstrate Los Angeles street jurisdiction, the above image illustrates the mosaic of Los Angeles City jurisdictions that currently oversee and maintain our public right-of-way (all of the public space from property lines on one side of the street to property lines on the other). As many as 11 separate City agencies are responsible for a certain component of our streetscape. It is understandably confusing. And it is no wonder most residents do not know where to start when they need to request basic city services, maintenance, or repairs.
The table below outlines the seveninfrastructure agenciesof the City of Los Angeles. Each agency has their own executive leadership and mission statement. It should be noted that the Department of Transportation and Department of Water & Power are each standalone city departments with an executive General Manager. The five bureaus below a) together comprise the Department of Public Works; b) are each led by a Director; and c) each report to a Mayor-appointed citizen commission known as the Board of Public Works.
Why are there so many agencies?
The City of Los Angeles is unique from other large U.S. cities. Our city and local government are very decentralized: Los Angeles spans over 450 square miles; we have a strong City Council system (compared to an institutionally weak executive office of the Mayor); and many of our city services departments work separately from each other.
Decentralization of power can promote communication and consensus, rather than focusing absolute power in the hands of one entity. However this process can also create inefficiencies and require excess process, particularly without shared priorities and missions. And when there is poor communication or limited consensus, it can be hard to get anything done. Or know who is responsible for getting the thing done at all.
What does this mean for Los Angeles residents and businesses?
Most people living in cities do not look at the street and identify which department or bureau is in charge of what utility or piece of infrastructure. Most people just want to live in safe, clean, and accessible neighborhoods with basic quality maintenance and city services. And we pay taxes to provide for these services with public dollars.
Los Angeles is the only large city in the country without acitywide capital plan. This means that public infrastructure planning, design, and construction are handled separately by different agencies. When communication and consensus break down, local governments can struggle to provide basic services with an efficient and effective investment of public dollars. A prime example is when we might see utility crews digging up a street that was freshly resurfaced and restriped just a few weeks earlier.
How can we improve on this?
The City’s Chief Administrative Officer (CAO) has produced a report, “Evaluation of the State of Street Related Infrastructure Programs in Los Angeles,” written by FUSE fellow Laila Alequresh. The report is a thorough and detailed document that explains the history of Los Angeles infrastructure agencies. Its most impactful recommendation is tomove the Department of Transportation into the Department of Public Works as a Bureau, similar to the existing five bureaus described above. The report recommends this to centralize the City’s transportation and street infrastructure agencies, which often rely on each other’s separate work plans to deliver projects.
On paper, this move could make sense. It is logical that the various agencies that work on streets and sidewalks should be housed in the same administrative body. This could lead to better projects and delivery of services. However, this logic only applies if the inter-bureau coordination and communication of the Public Works Bureaus work well together toward shared missions. The CAO FUSE report does not affirm or deny that there is currently streamlined, successful coordination between Bureaus within the Department of Public Works.
The report also recommends creating an Office of Infrastructure Management within the Board of Public Works. The new office would provide support for transportation and street-related services and strategic delivery of capital projects. This office may be intended to streamline and improve inter-bureau coordination and project delivery, but an assessment of impact is still needed.
The report will be presented to the Public Works and Gang Reduction Council committee this Wednesday, December 6, at 1:00 p.m. at City Hall. We will be tracking these recommendations and providing our analysis about how our decentralized city government can improve the public right-of-way and quality of life for all of our city residents.
*Sidewalk repair: Bureau of Engineering; crosswalk: Department of Transportation; street tree: Bureau of Street Services. The street image is from a manual created by the Mayor’s Office Great Streets Initiative and is available for download at lagreatstreets.org/diymanual
On Saturday, October 21st, Panorama High School was host to the second Tripping Point: the Valley Edition. With over 60 community members, five neighborhood councils, and our special year 0-5 crew joining, the day was filled with ways to gain skills in advocacy, local civic engagement, and how to access the basic city service of good, accessible sidewalks.
From childcare with First Steps Mobile and intrepretation with Antena, as well as a local street vendor for “frutas frescas” – the Tripping Point is committed to meeting community members where they are. The Valley is home to the Orange Line, one of the most effective bus rapid transit lines in the country. Because all bus riders are pedestrians, the Valley is also home to the most dangerous intersections in the state of California.
In the Valley, the need is great as well as the demand for accessible and safe sidewalks.
Sidewalks are multi-faceted and encompass more than safety and accessibility, but also urban greening and public health. Our steering committee included Koreatown Youth Community Center, Los Angeles Walks, LURN, Outfront/JCDecaux, AARP Los Angeles, American Heart Association, Empower LA, and the Southern California Resource Center for Independent Living.
Keynoting our day were Hector Ochoa, Los Angeles County Disability Commissioner, Luz Rivas, Board of Public Works Commissioner, Ted Bardacke, Mayor Eric Garcetti’s Director of Infrastructure, and Councilmember Nury Martinez, Los Angeles City – District 6.
Hector, a steering committee member, shared his personal experience in addressing the shortcoming of the city’s ability to respond to ADA access requests.
As the City of Los Angeles works to be compliant with the Willits settlement, the backlog of ADA access requests is only the “tripping point”. Ever month, there are over 100 requests sent to the Sidewalk Repair Program. The City has averaged fixing 70-80 sidewalks a year. If you were to send a request in today – it is likely that you will be waiting for two years minimum.
Luz Rivas, a Valley native, shared that the City is extremely committed to addressing the needs.
“There are people in City Hall who care very much about the Valley. We’re here to support you.” -Luz Rivas, Commissioner of Public Works pic.twitter.com/dqOI3yQSp0
Ted Bardacke, Director of General Infrastructure, noted that sidewalks are key to connecting our communities with every day resources.
The Sidewalk Repair Program is an opportunity for the City of Los Angeles to address its most basic quality-of-life infrastructure. Safe and comfortable sidewalks and crosswalks serve all travelers, improve local economy, and can create vibrant public gathering spaces.
Rather than treated as separate from streets and transit, planning and funding sidewalks should be considered part of a comprehensive transportation network . We look forward to a future where our city is connected by a robust sidewalk and crosswalk network with ample shade and amenities, access to transit with safe and dignified bus stops, patrons connected to commercial and cultural destinations, stormwater runoff treatments, and safe passage for travelers of all ages and abilities.
Community members were then able to choose from a variety of tools being offered:
Morning Session
Sidewalks 101 – Investing in Place
Trees in Your Neighborhood – Koreatown Youth Community Center
Advocacy Made Easy: How to Get What You Want – Los Angeles Walks
Neighborhood Councils 101 – Empower LA
Afternoon Session
How to Communicate with Decisionmakers – LURN
The City’s Plan to Make Sidewalks Safe and Accessible – Bureau of Engineering/Department of Disability
People Street – Great Streets
Hands-On Walk Audit Training – Los Angeles Walks
Consistently drawing larger crowds are Los Angeles Walks’ Advocacy Made Easy and LURN’s How to Communicate with Decisionmakers. Community members are the experts of their communities. They are seeking for the “how-to’s” to advocate for themselves and make their voices heard.
A longtime advocate people having a safe and walkable sidewalk is Councilmember Nury Martinez. On her turf, the Councilmember was fired up and proud to host the Tripping Point in her district. Stemming from her own experience watching her father take public transportation every day of his career, sidewalks are an extremely personal issue.
“It is my responsibility as your Councilmember – if Hollywood and Highland can get zero fatalities with a pedestrian scramble – what’s the difference between Hollywood and Panorama City?” Safety and pedestrian lives are a critical component to bringing transportation equity to the Valley.
Another factor the Valley is known for is its extreme heat during the summer. Molly Peterson, an environmental journalist, shared her urban heat mapping work with the community members just down the street in Pacoima. The group was able to contribute more data points and demonstrate which streets experience the most heat and are in need of bus shelters.
One of the key takeaways we had from our first Tripping Point in Boyle Heights was ensuring we had concrete next steps. Community members wanted their decisionmakers to know that they were ready to fight for their sidewalks. We were inspired to create postcards and send our concerns to our city representatives.
If you would like to join us in our campaign for #LAsidewalks, please join our work group ‘Completing Streets: Fixing City of LA Sidewalks’ or feel free to reach me at amanda@investinginplace.org.
Richard France assists clients with strategic planning, visioning, and community and economic development. He is a strategic planner at Estolano Advisors, where he has been involved in a variety of active transportation, transit-oriented development, climate change resiliency, and equitable economic development projects. His work in active transportation includes coordinating a study to improve bike and pedestrian access to transit oriented districts for the County of Los Angeles, and working with the Southern California Association of Governments to host tactical urbanism events throughout the region. Richard also serves as a technical assistance provider for a number of California Climate Investment programs, including the Affordable Housing Sustainable Communities, Transformative Climate Communities, and Low Carbon Transit Operations programs. He has also taught at the UCLA Luskin School of Public Affairs. Richard received a Bachelor of Environmental Design from the University of Colorado at Boulder, and his M.A. in Urban Planning from UCLA.
Accelerator for America, Milken Institute
Matt Horton
Matt Horton is the director of state policy and initiatives for Accelerator for America. He collaborates with government officials, impact investors, and community leaders to shape infrastructure, job creation, and equitable community development efforts. With over fifteen years of experience, Matt has directed research-driven programs and initiatives focusing on housing production, infrastructure finance, access to capital, job creation, and economic development strategies. Previously, he served as the director of the California Center at the Milken Institute, where he produced research and events to support innovative economic policy solutions. Matt also has experience at the Southern California Association of Governments (SCAG), where he coordinated regional policy development and planning efforts. He holds an MA in political science from California State University, Fullerton, and a BA in history from Azusa Pacific University. Additionally, Matt serves as a Senior Advisor for the Milken Institute and is involved in various advisory boards, including Lift to Rise and WorkingNation.
UCLA Lewis Center for Regional Policy Studies
Madeline Brozen
Madeline is the Deputy Director of the UCLA Lewis Center for Regional Policy Studies at the Luskin School of Public Affairs. She oversees and supports students, staff, and faculty who work on planning and policy issues about how people live, move, and work in the Southern California region. When not supporting the work of the Lewis Center community, Madeline is doing research on the transportation patterns and travel needs of vulnerable populations in LA. Her recent work includes studies of low-income older adults in Westlake, public transit safety among university students, and uncovering the transportation needs of women, and girls in partnership with Los Angeles public agencies. Outside of UCLA, Madeline serves as the vice-chair of the Metro Westside Service Council and enjoys spending time seeing Los Angeles on the bus, on foot, and by bike.
Office of Los Angeles Mayor Karen Bass
Luis Gutierrez
Luis Gutierrez, works in the Office of Los Angeles Mayor Karen Bass, as the Director of Energy & Water in the Office of Energy and Sustainability (MOES), Luis oversees issues related to LA’s transition to clean energy, water infrastructure, and serves as the primary liaison between the Mayor’s Office and the Department of Water and Power. Prior to joining MOES, Luis managed regulatory policy proceedings for Southern California Edison (SCE), focusing on issues related to equity and justice. Before joining SCE, Luis served as the Director of Policy and Research for Inclusive Action for the City, a community development organization dedicated to economic justice in Los Angeles. Luis holds a BA in Sociology and Spanish Literature from Wesleyan University, and a Master’s Degree in Public Administration from Cal State LA.
Communications Strategist
Kim Perez
Kim is a writer, researcher and communications strategist, focused on sustainability, urban resilience and safe streets. Her specialty is taking something complex and making it clear and compelling. Harvard-trained in sustainability, she won a prize for her original research related to urban resilience in heat waves—in which she proposed a method to help cities identify where pedestrians spend a dangerous amount of time in direct sun, so they can plan for more equitable access to shade across a city.
Jessica Meaney is the founder and executive director of Investing in Place.
She has spent more than two decades working across philanthropy, government, and nonprofit organizations in Los Angeles, focused on how cities care for public space. Jessica holds a BA from Prescott College and a master’s degree in urban sociology from California State University, Los Angeles.
Her background in urban sociology shapes how she understands infrastructure, not simply as physical assets, but as reflections of how cities allocate resources, set priorities, and shape daily life. She examines sidewalks, streets, and parks as interconnected civic systems influenced by governance, finance, and institutional design.
At Investing in Place, Jessica leads research, convenings, and long-term analysis of how Los Angeles manages its public realm. Her work increasingly explores how cities structure and sustain public space systems over time, contributing to broader conversations about public governance and the social life of infrastructure.
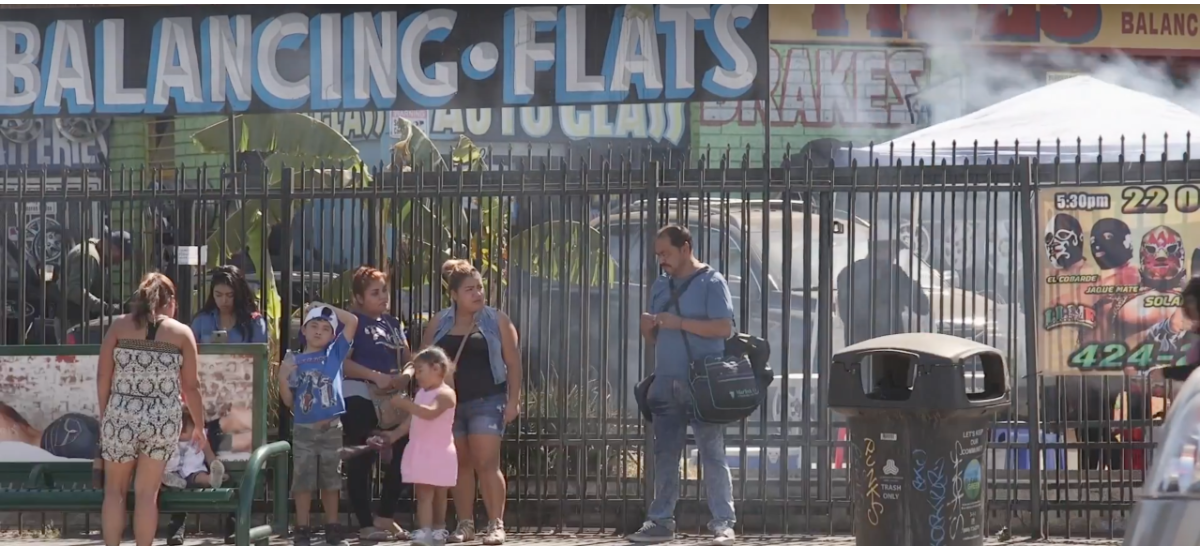
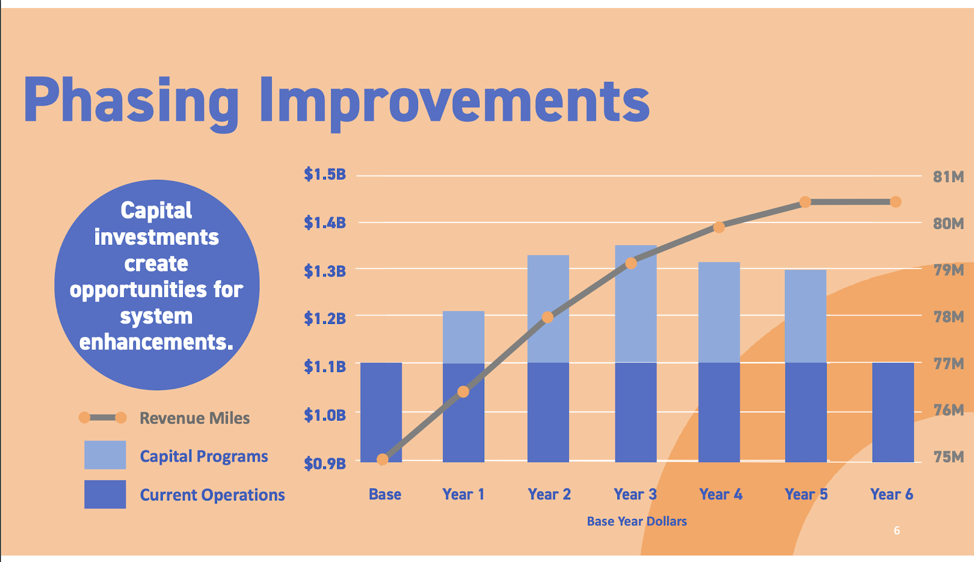
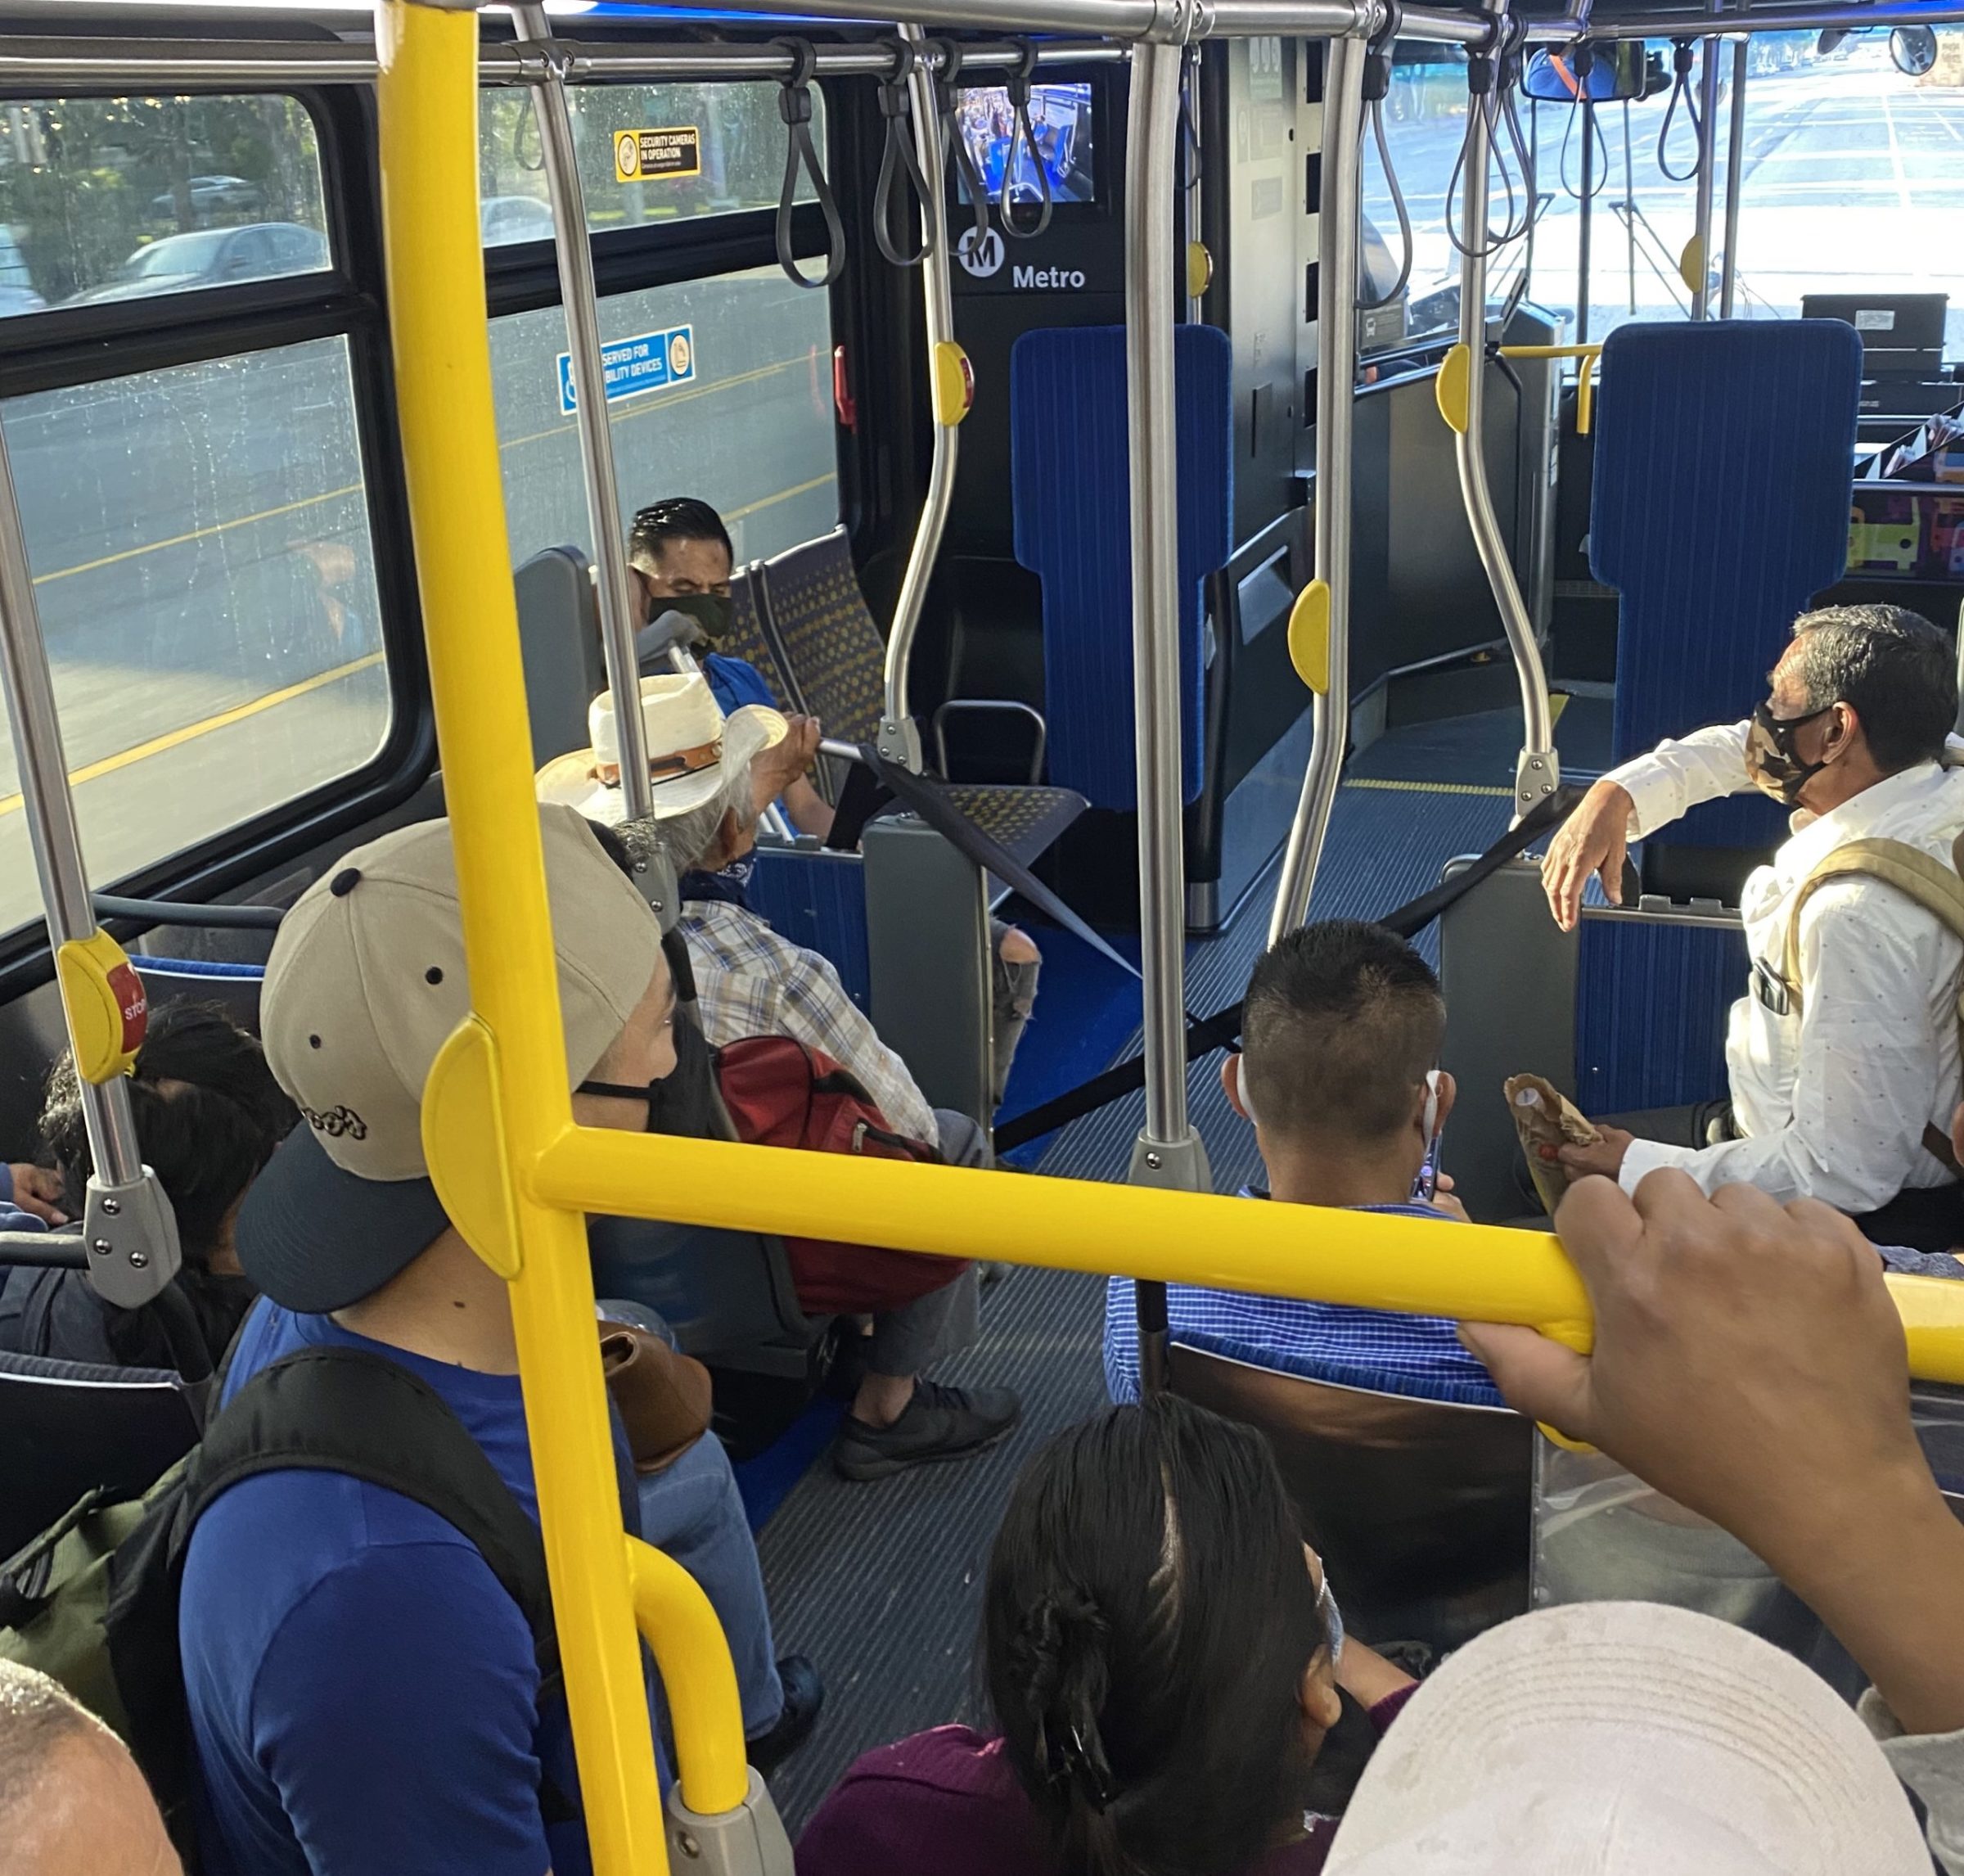
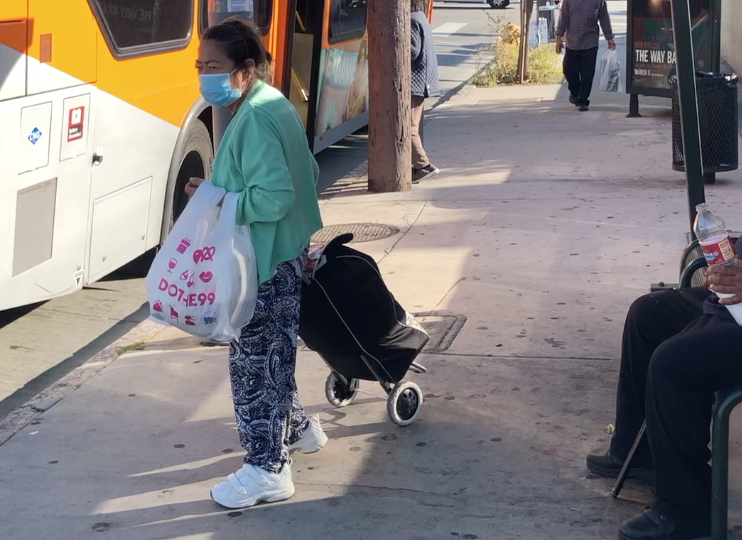
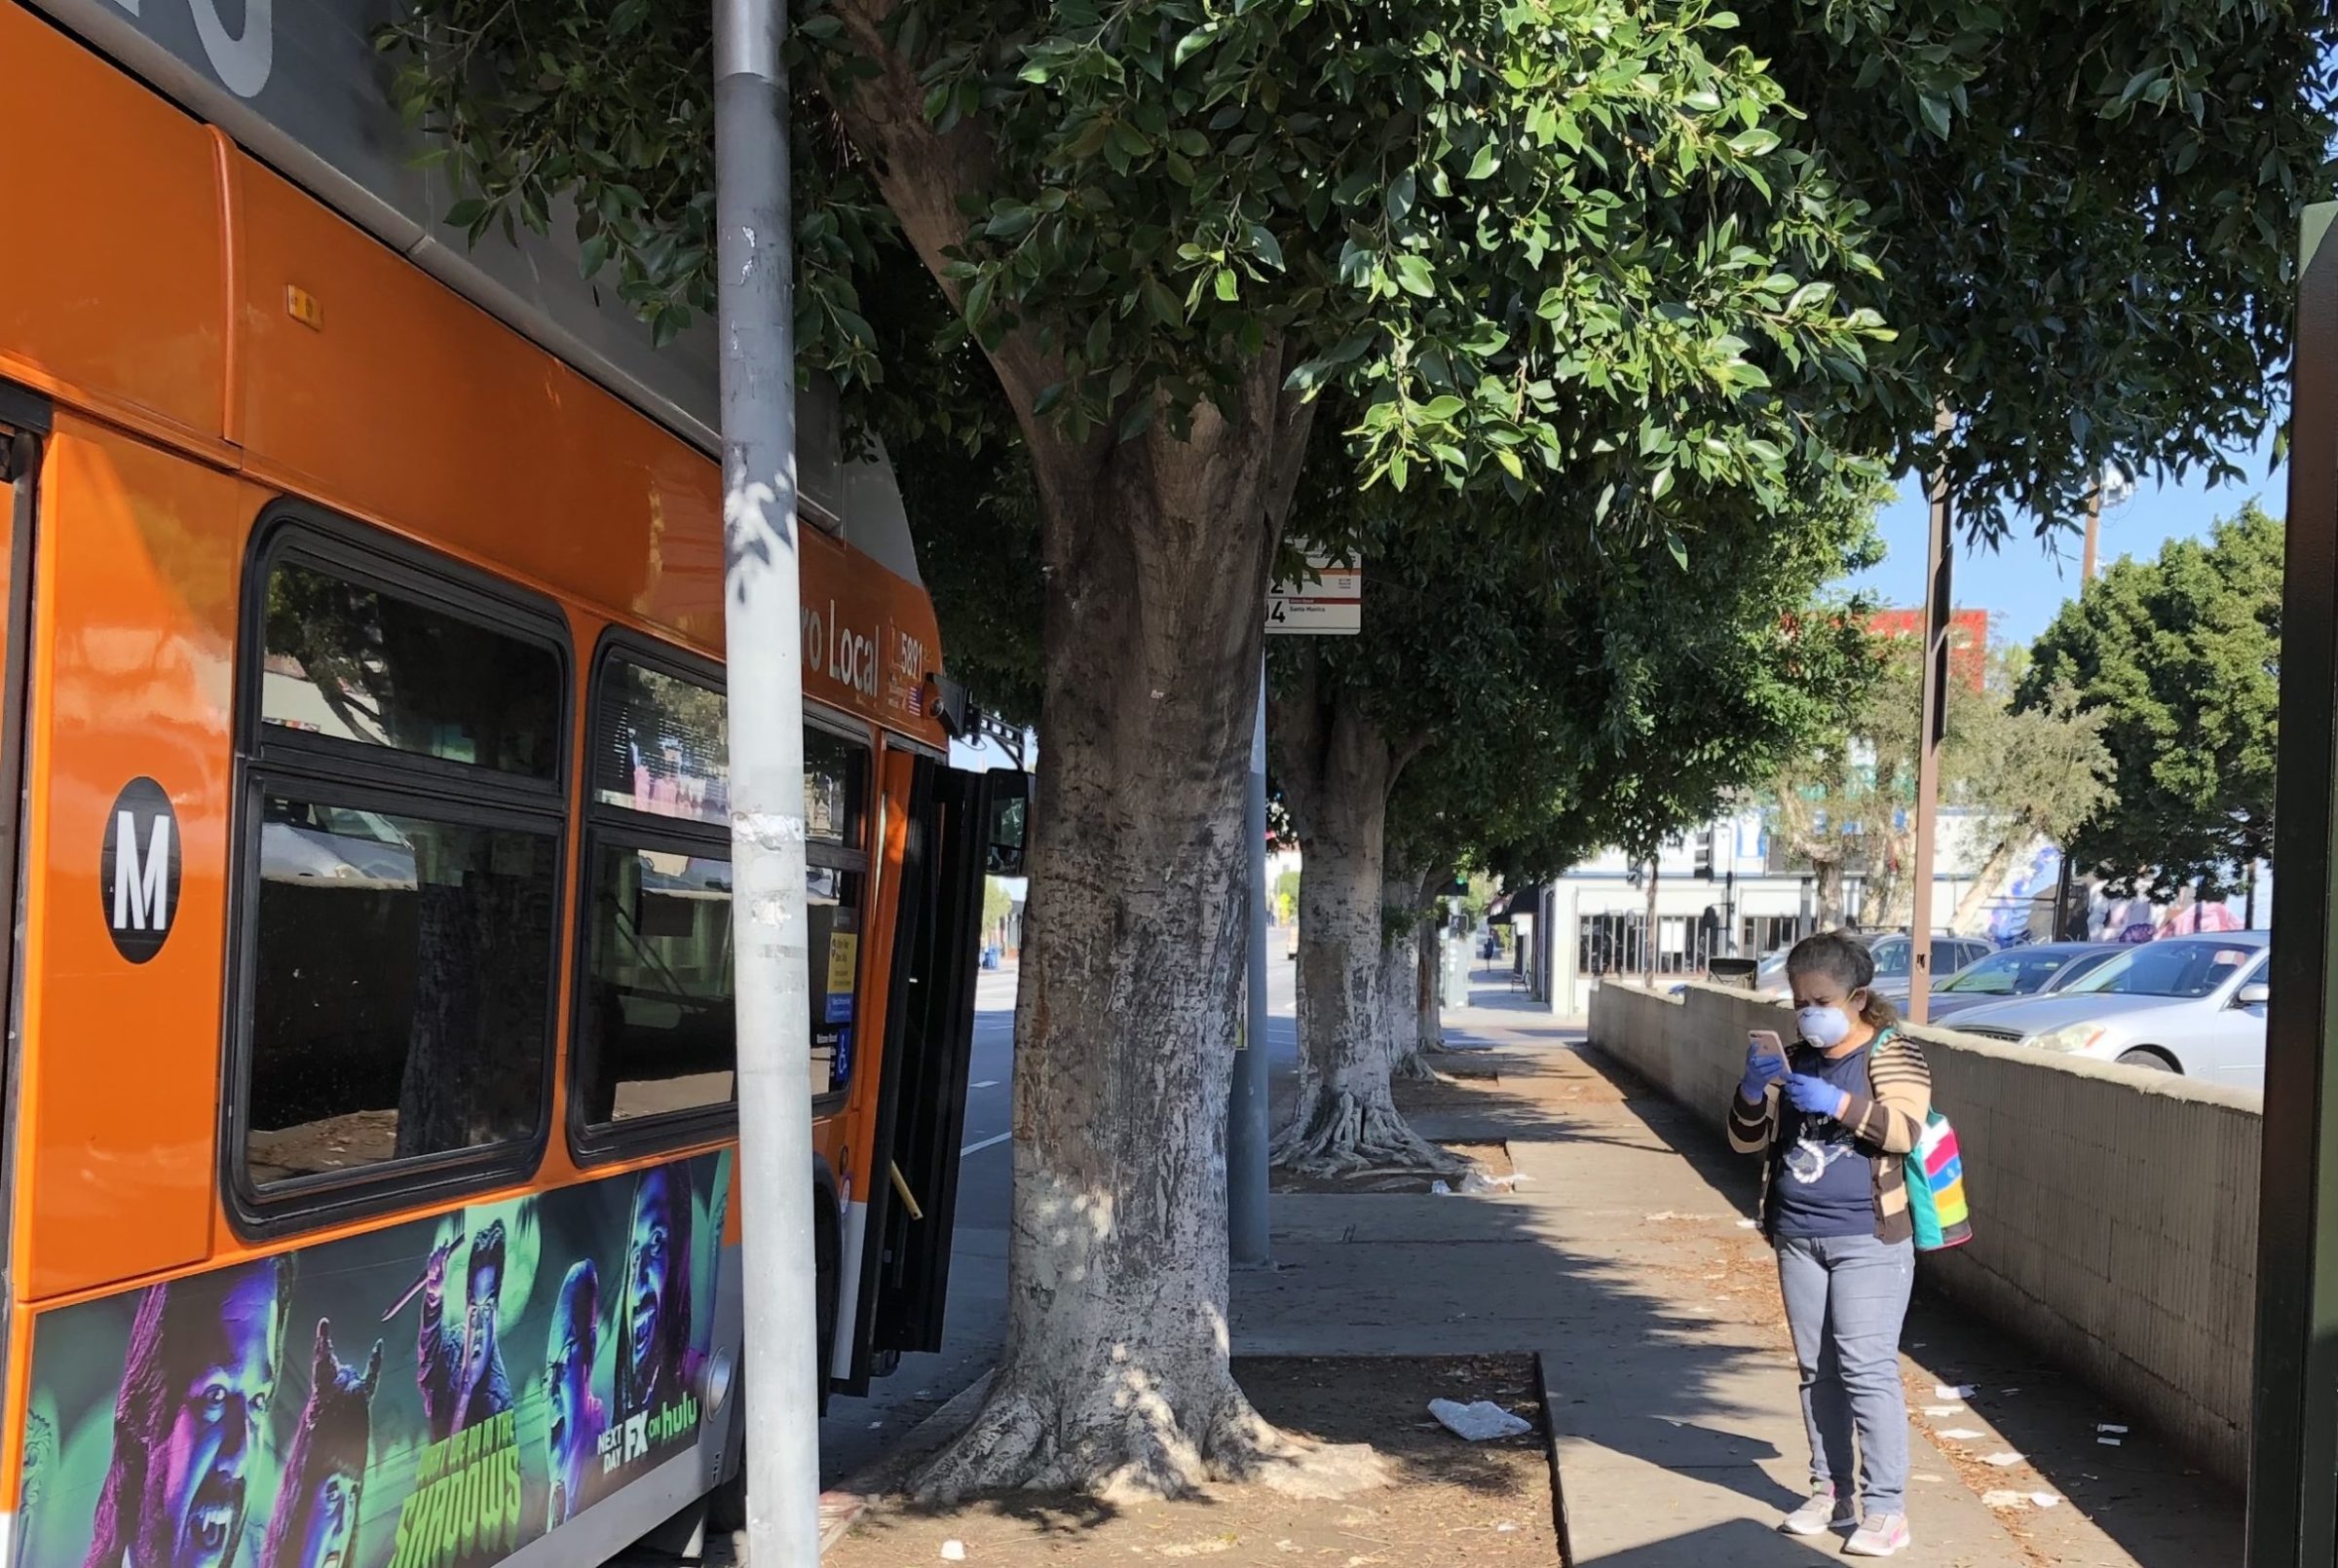
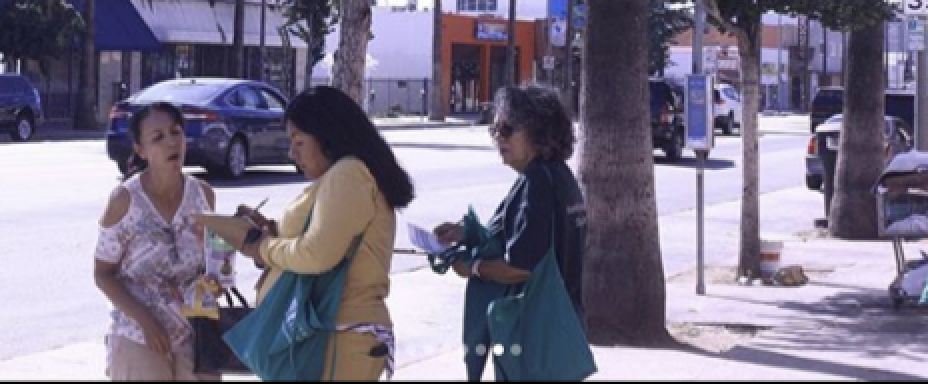
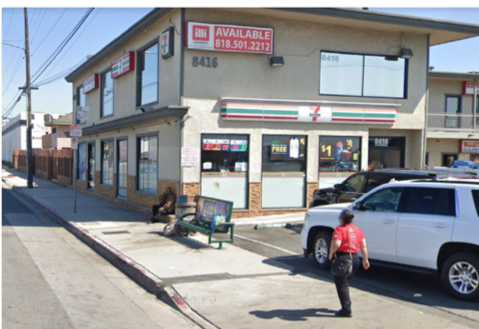
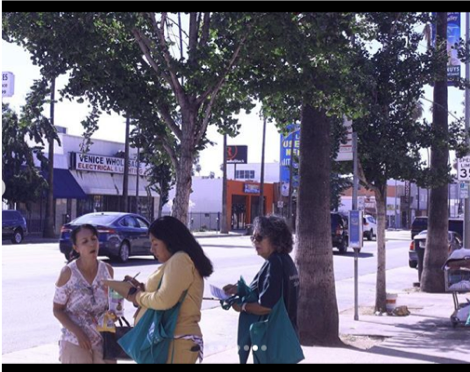
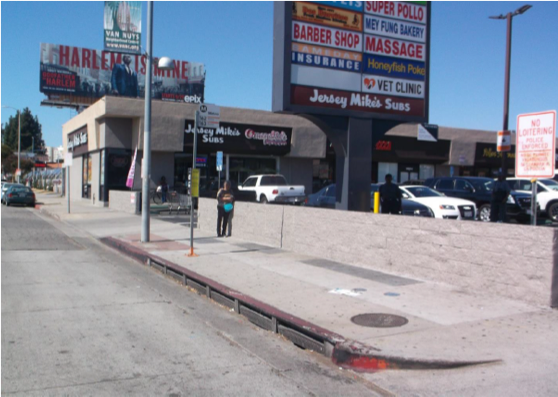
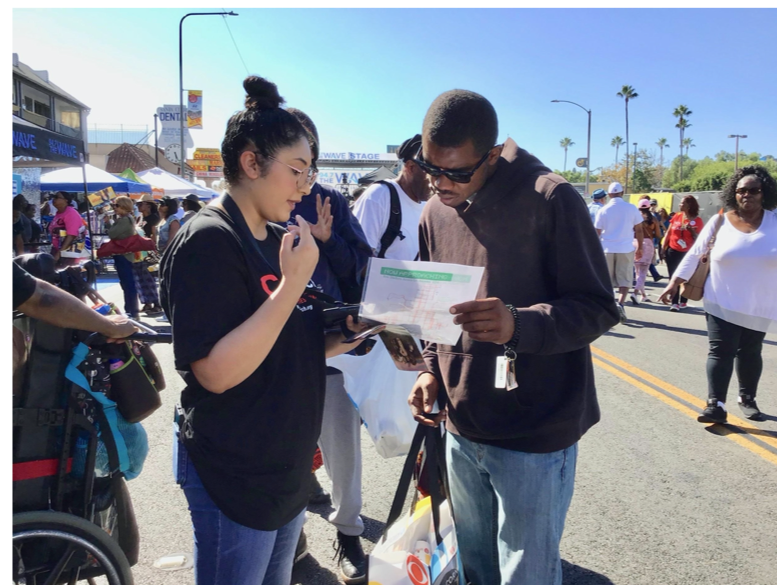
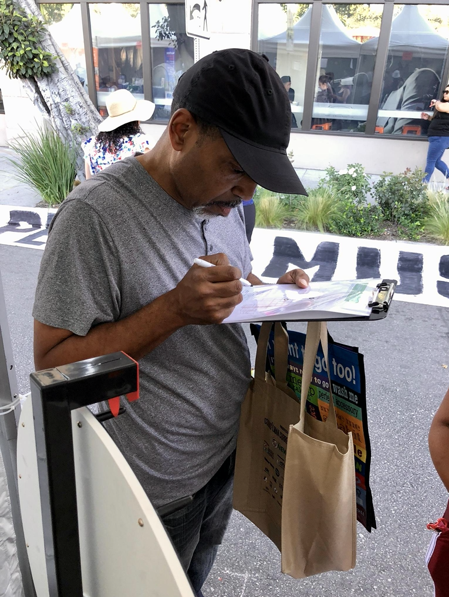 SLATE-Z Conducted community outreach at events and in neighborhoods in South LA.
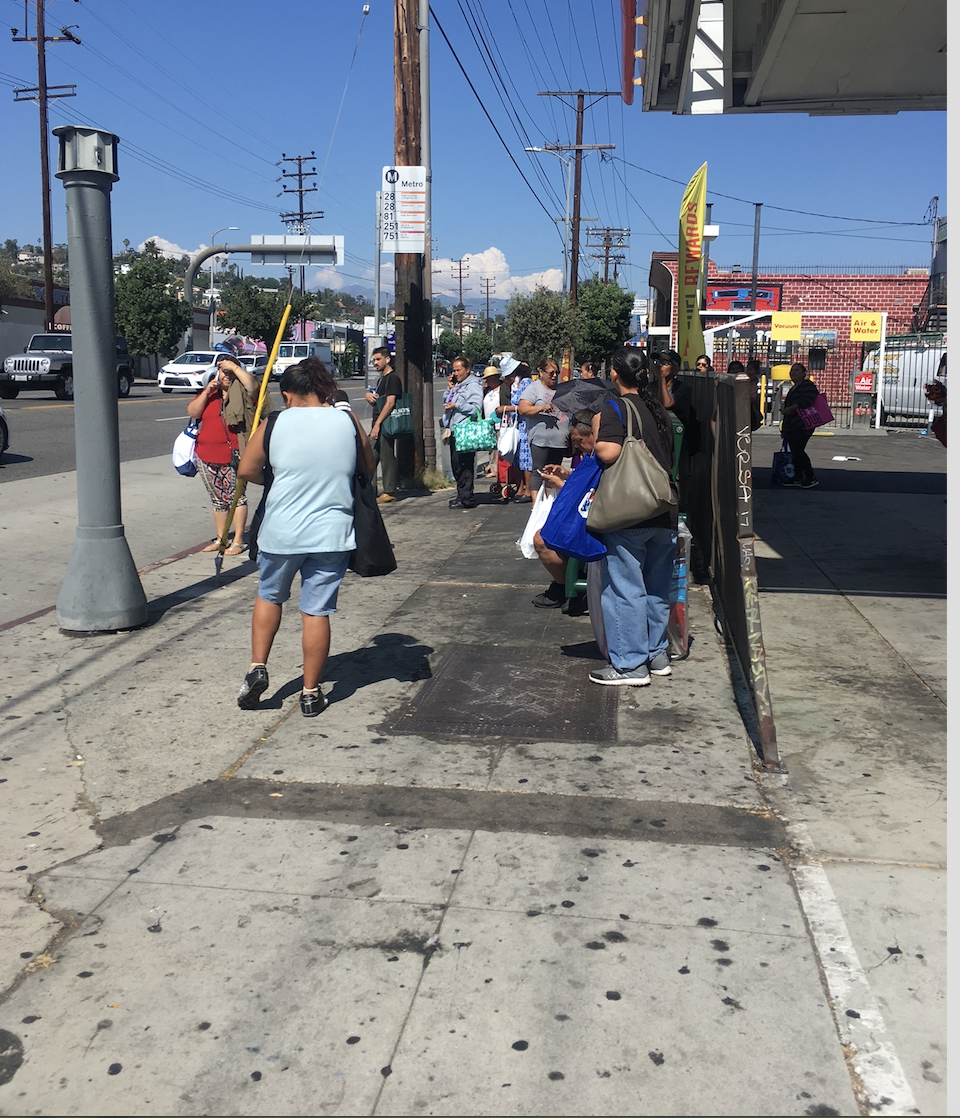

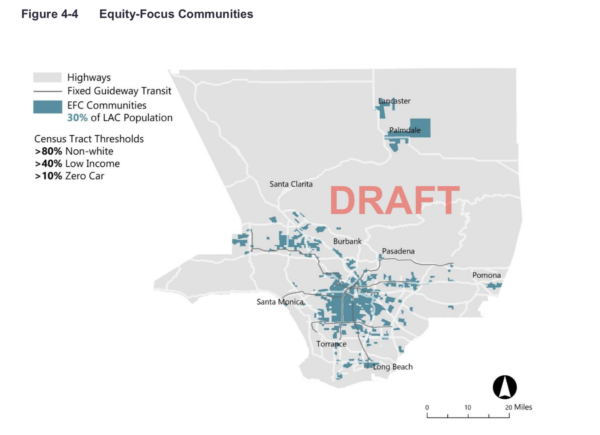
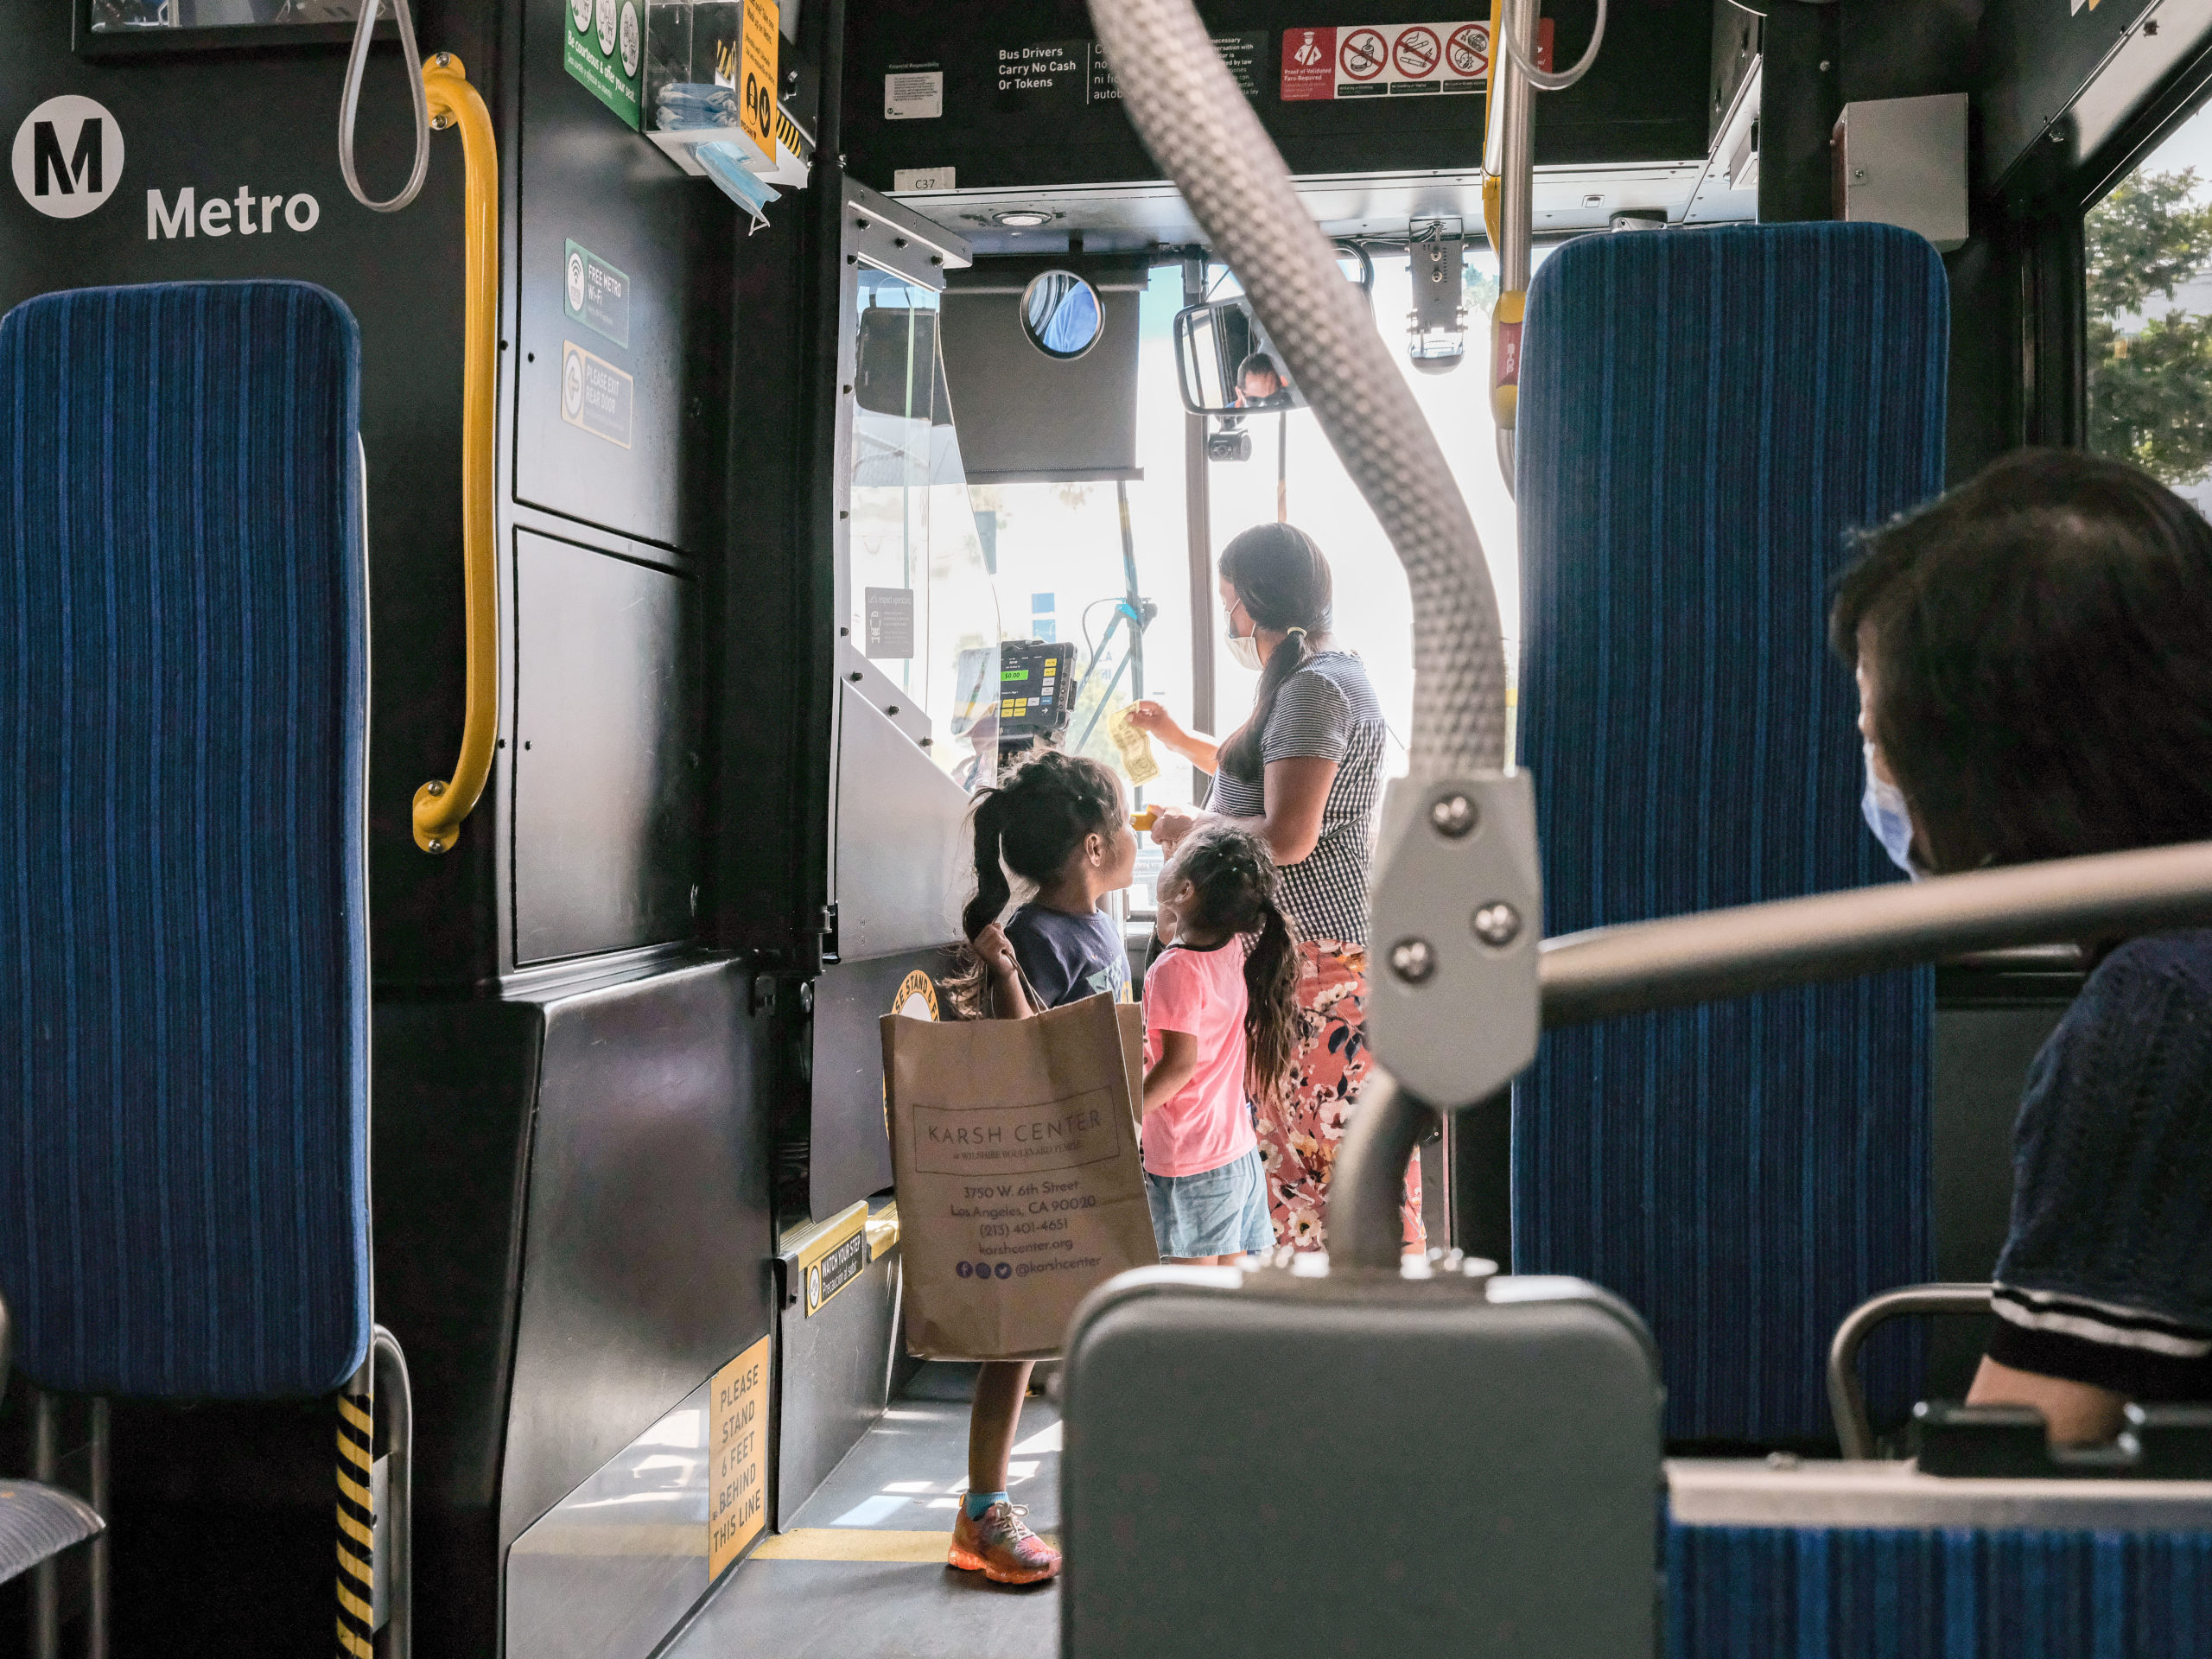


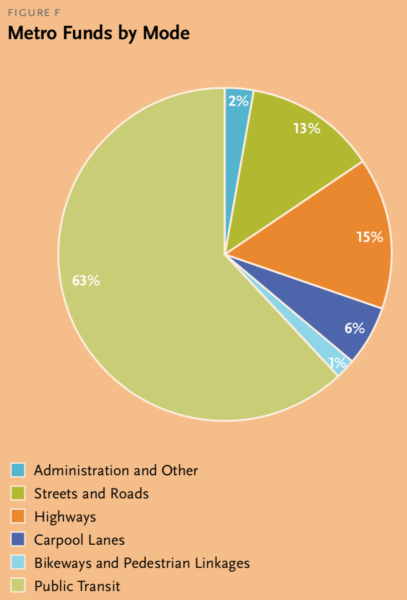
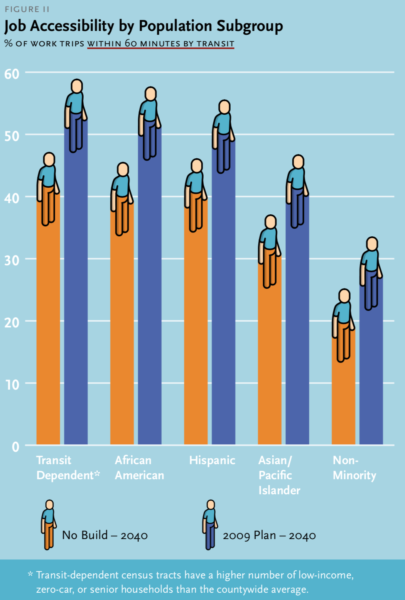

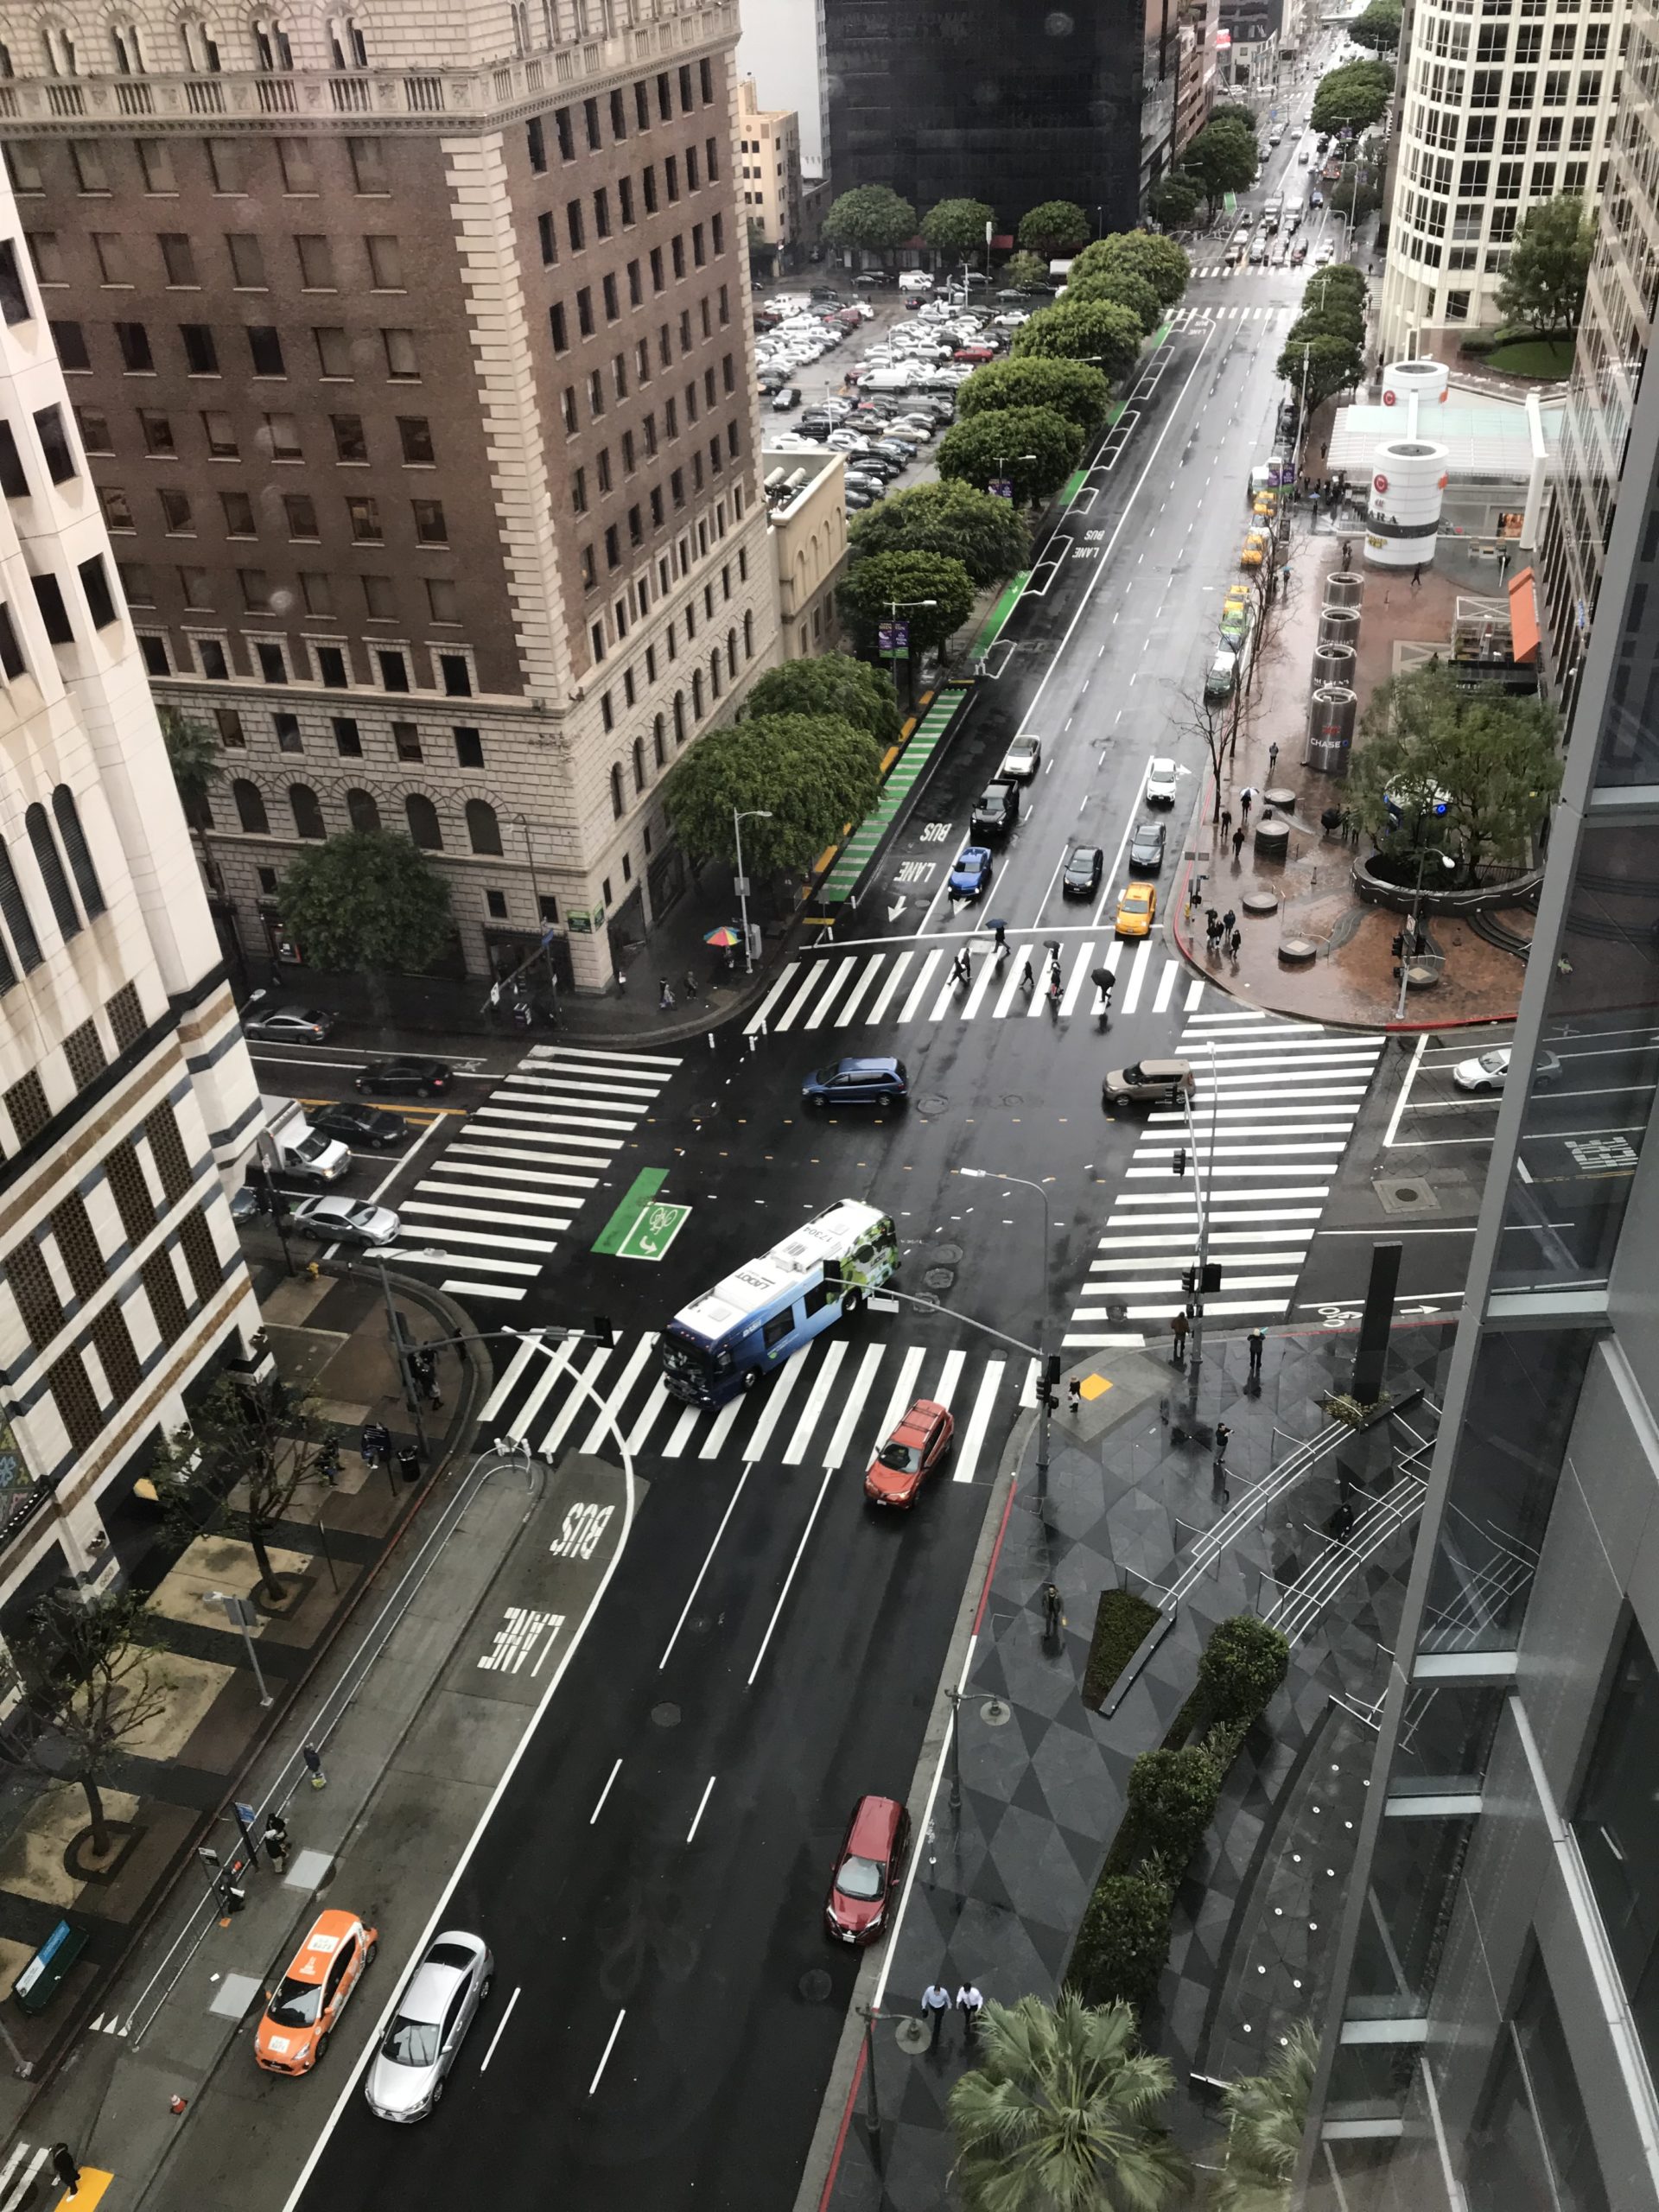
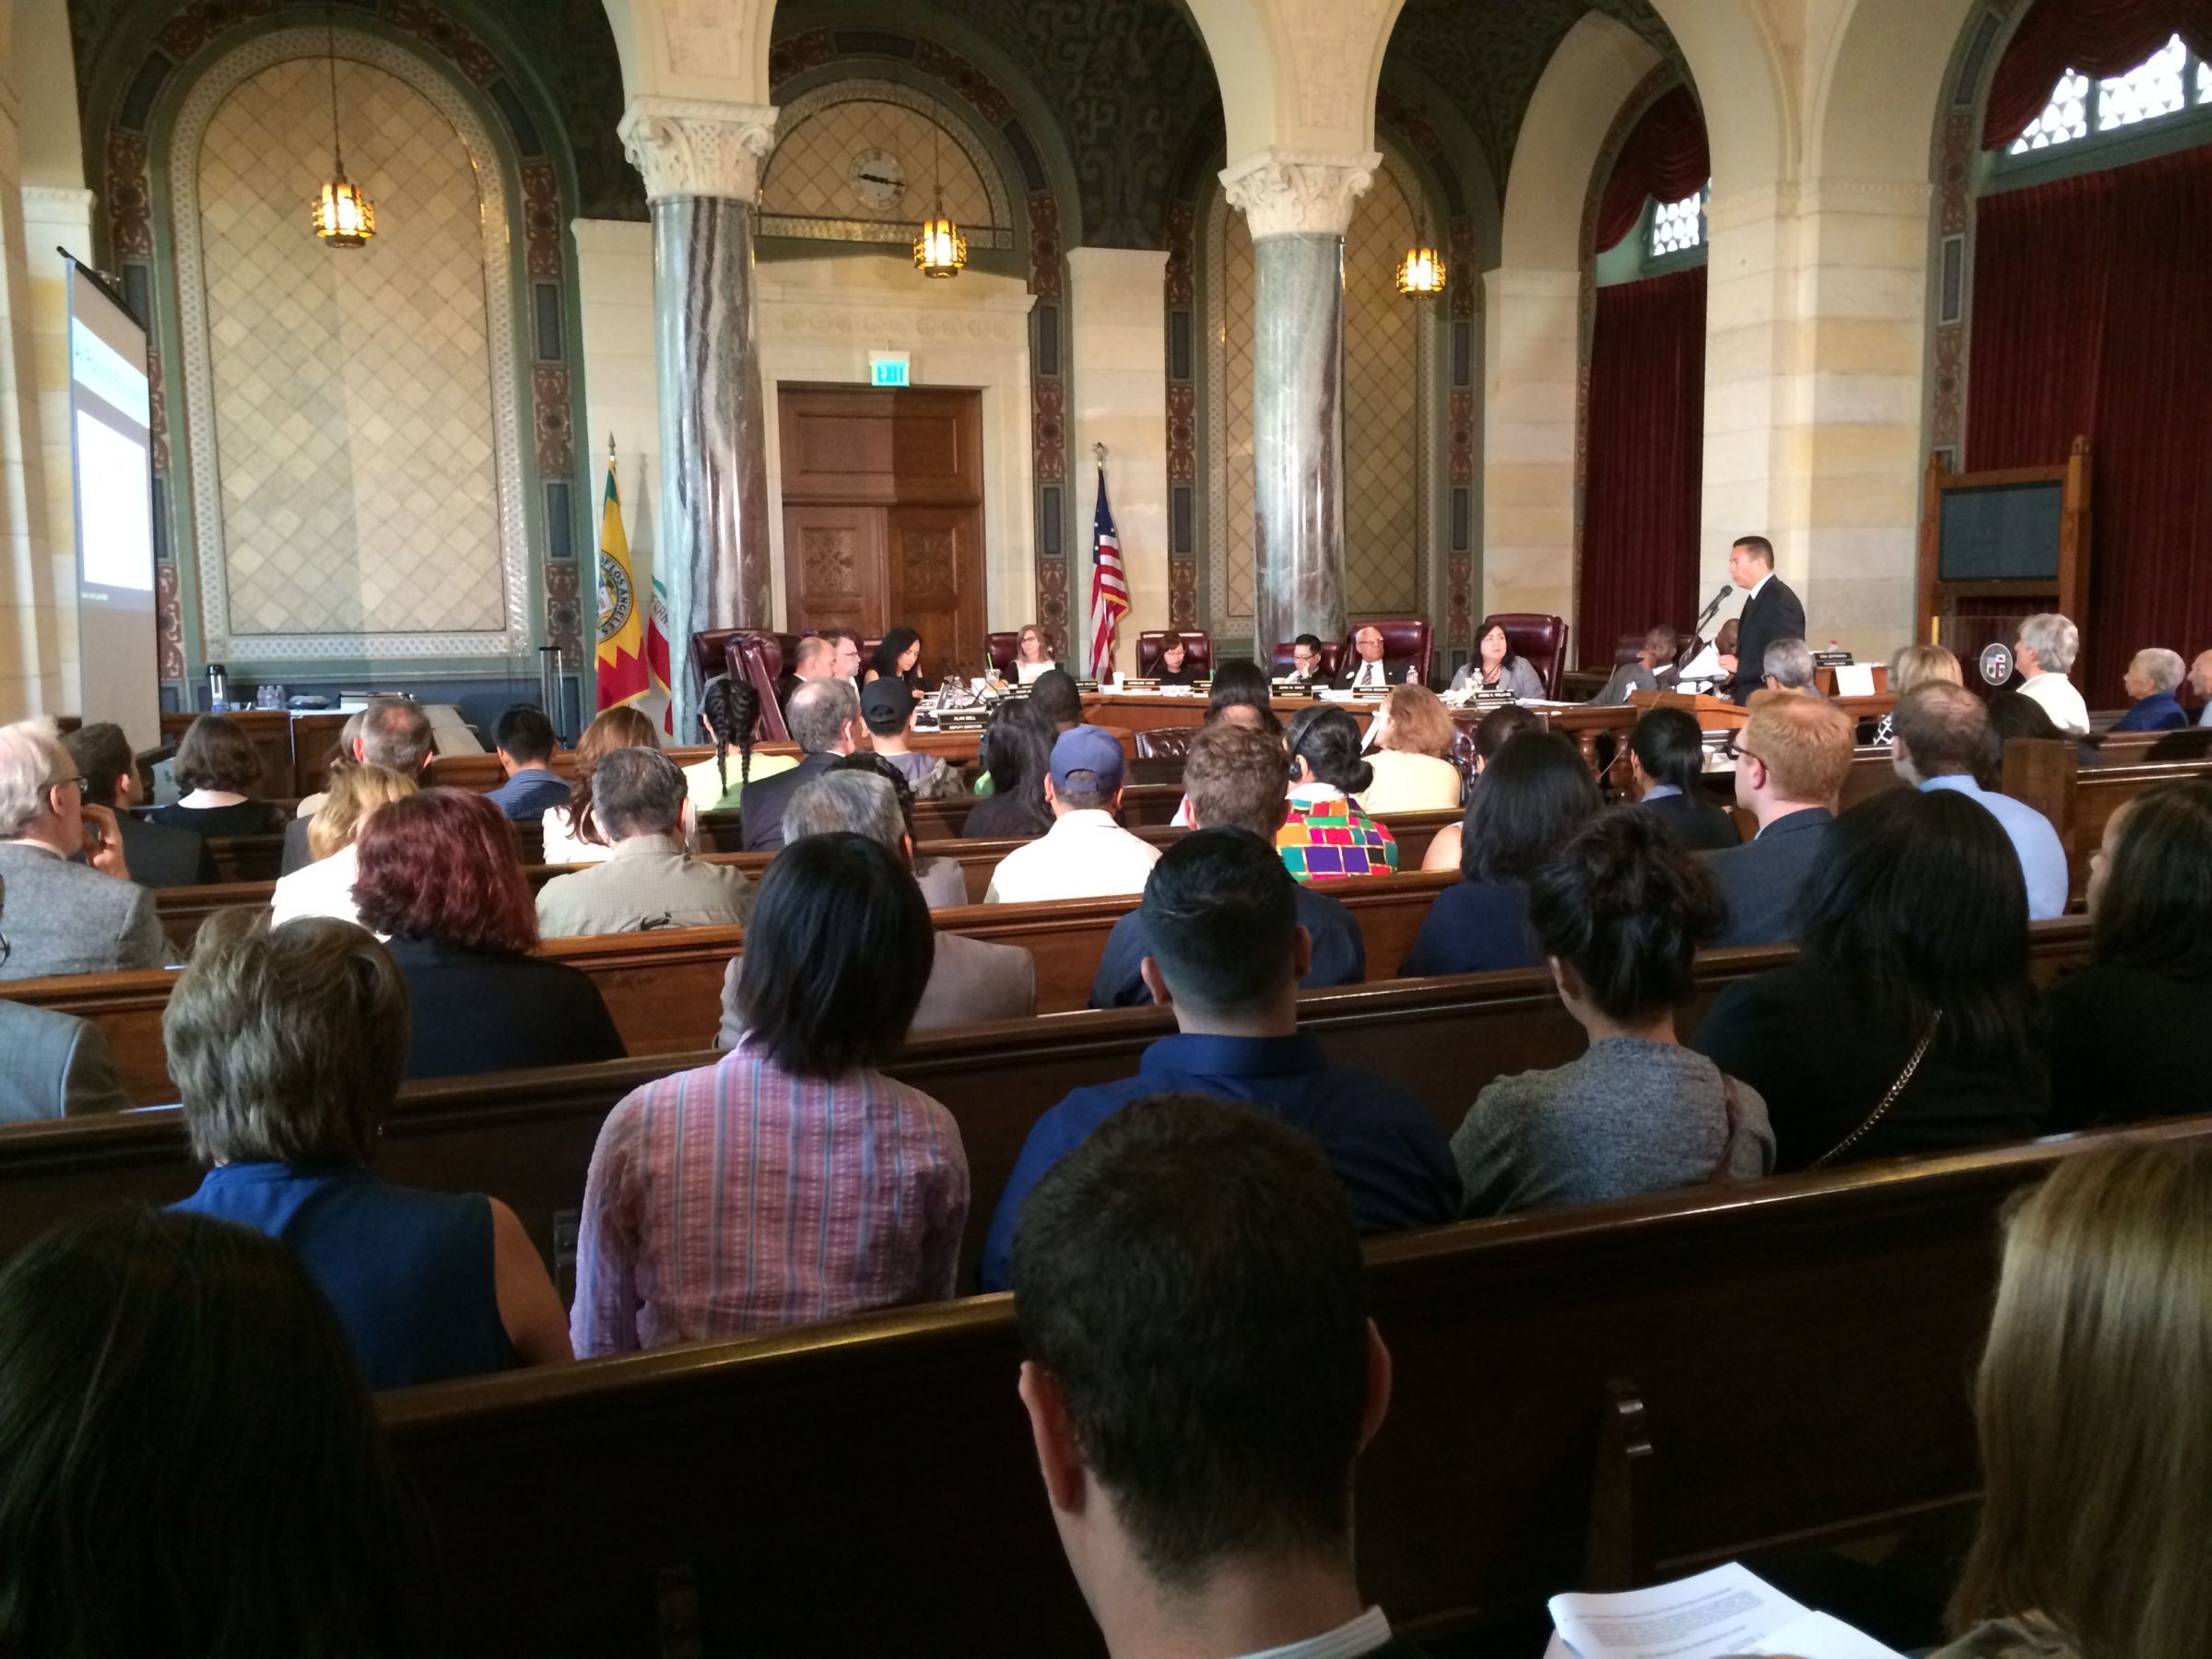

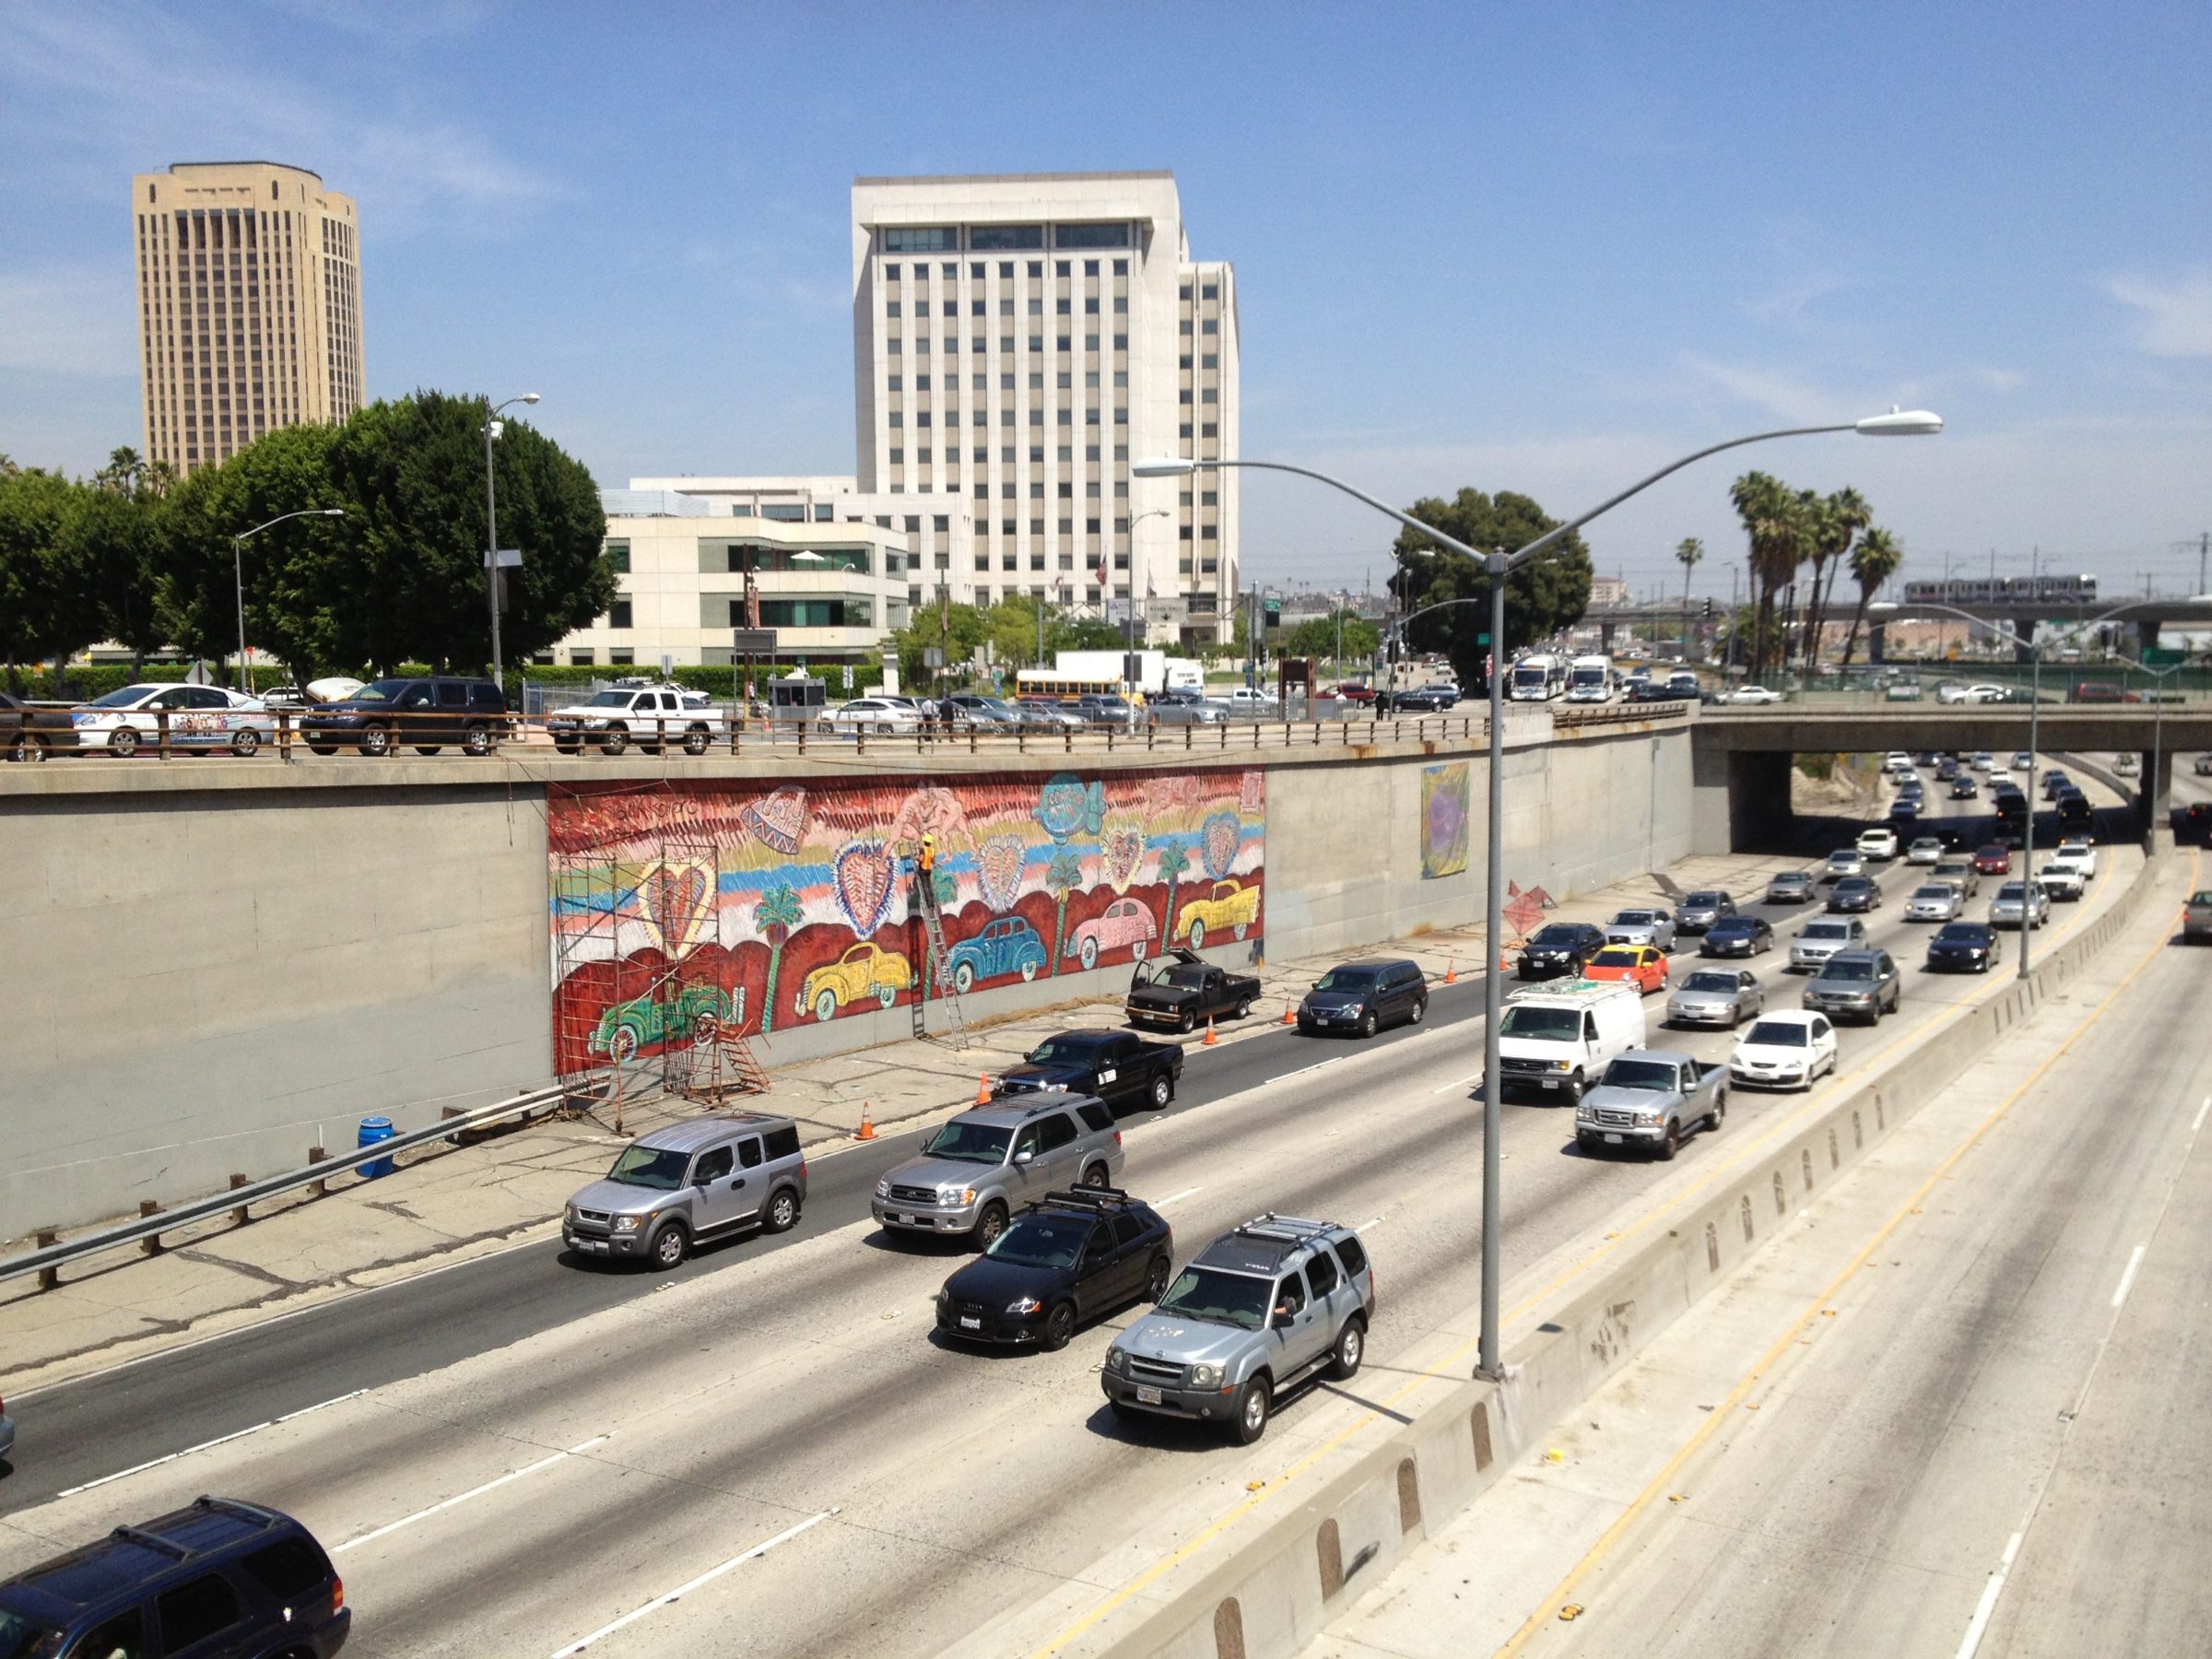
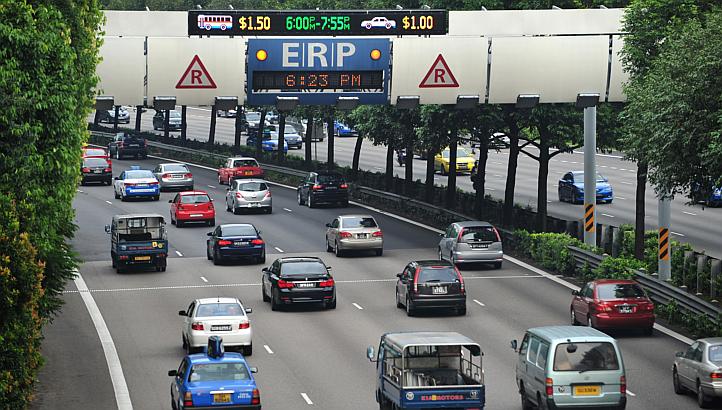

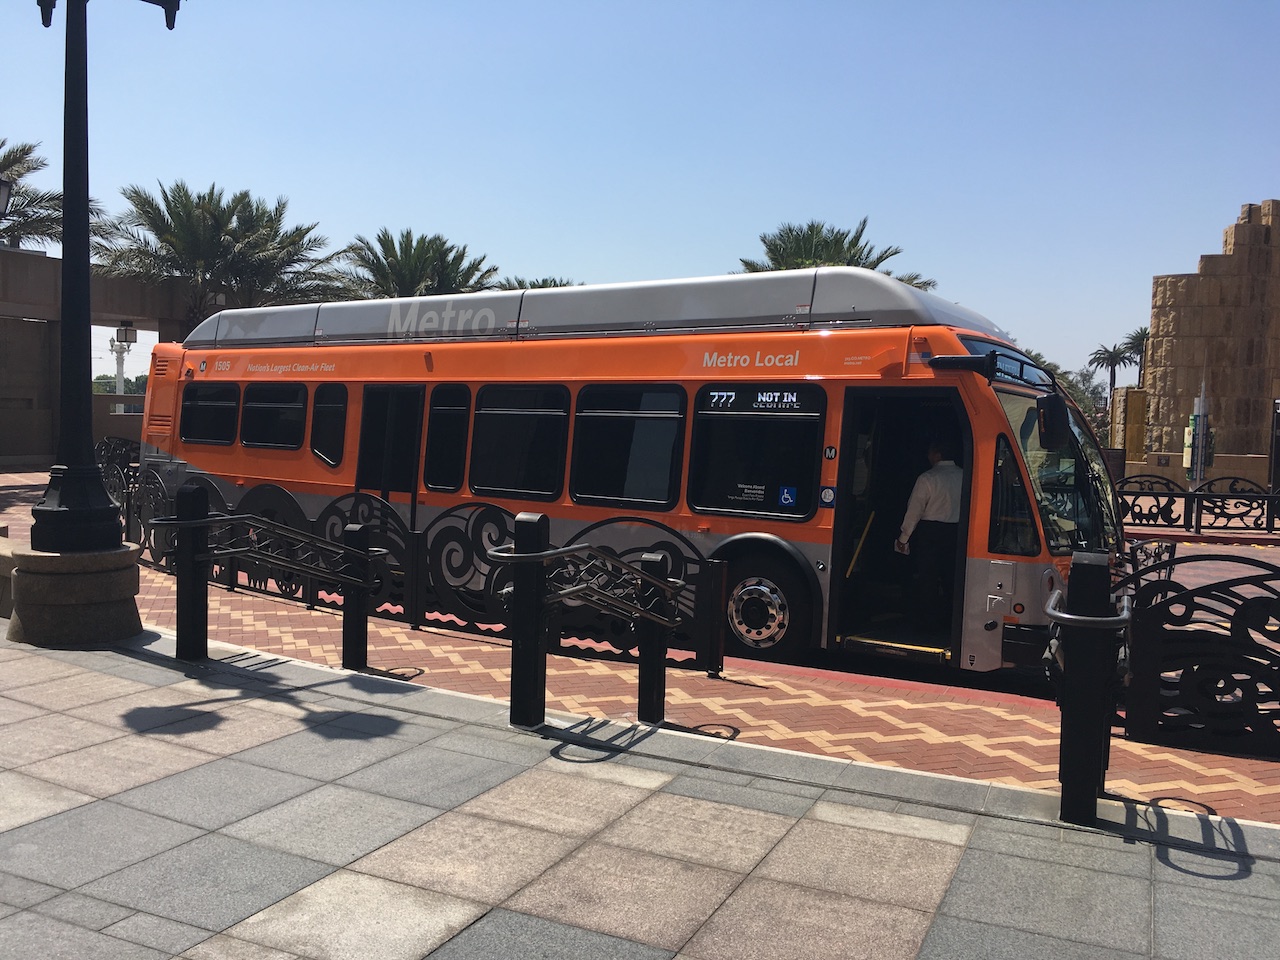
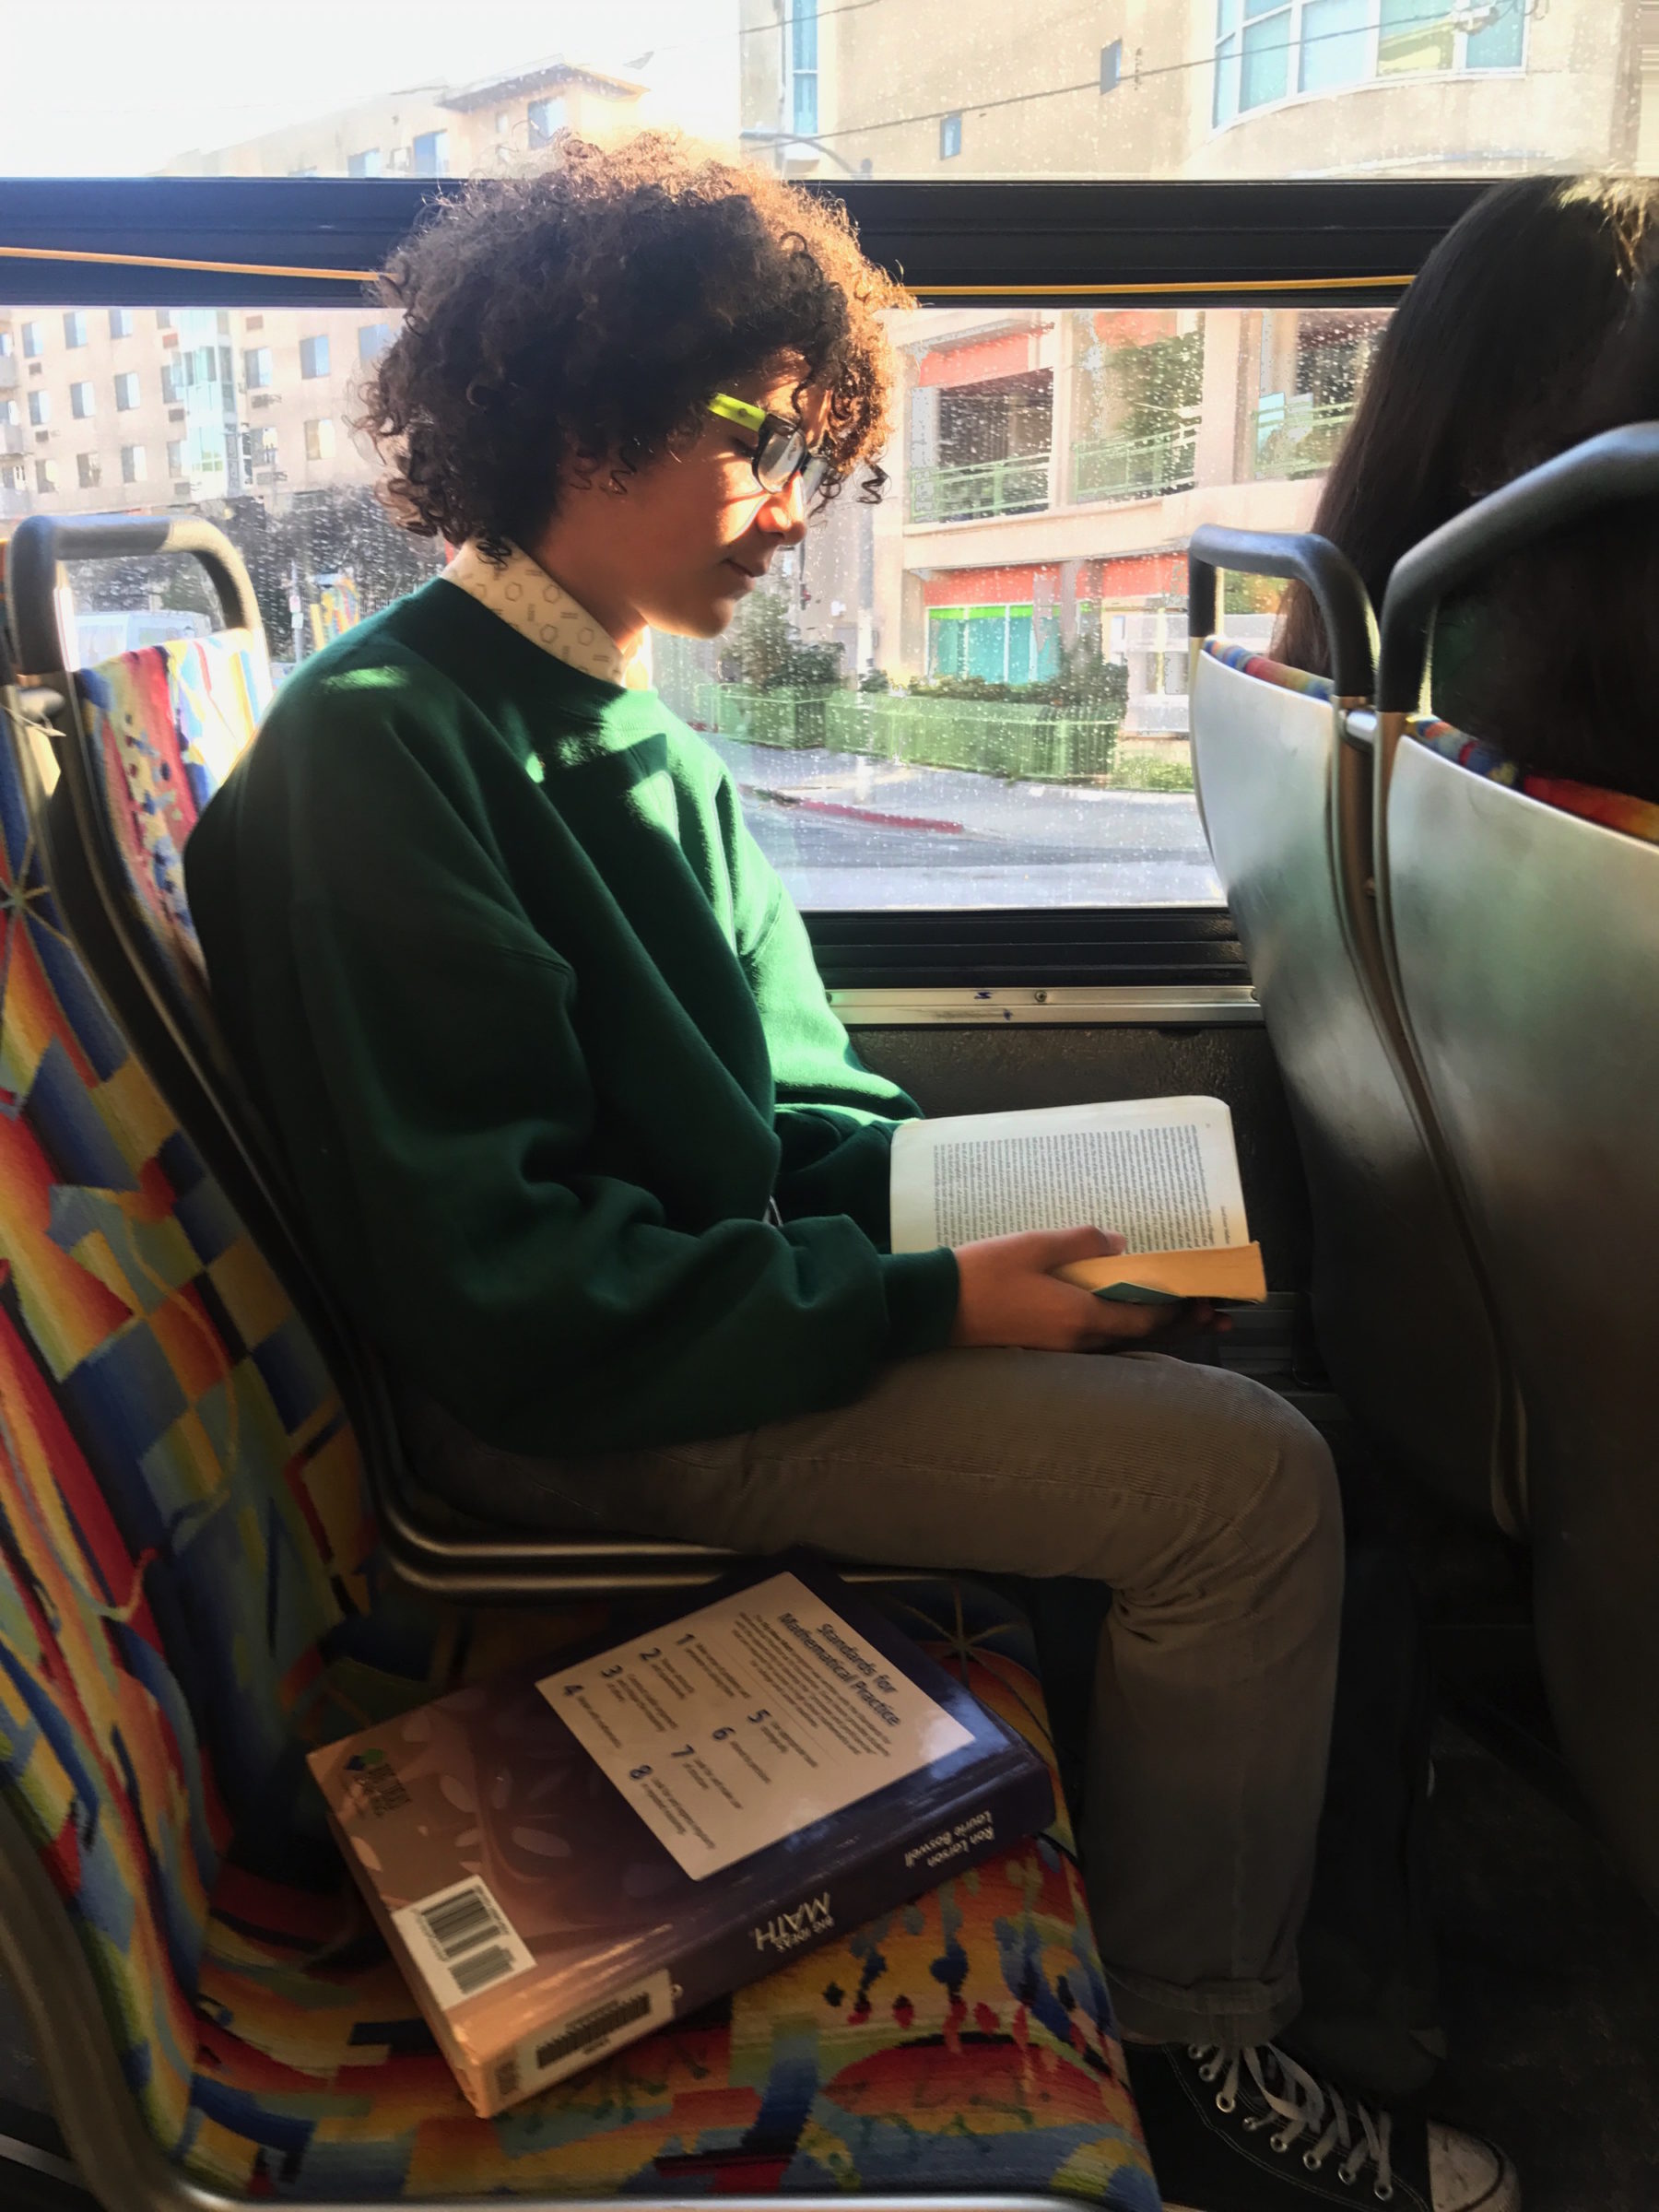
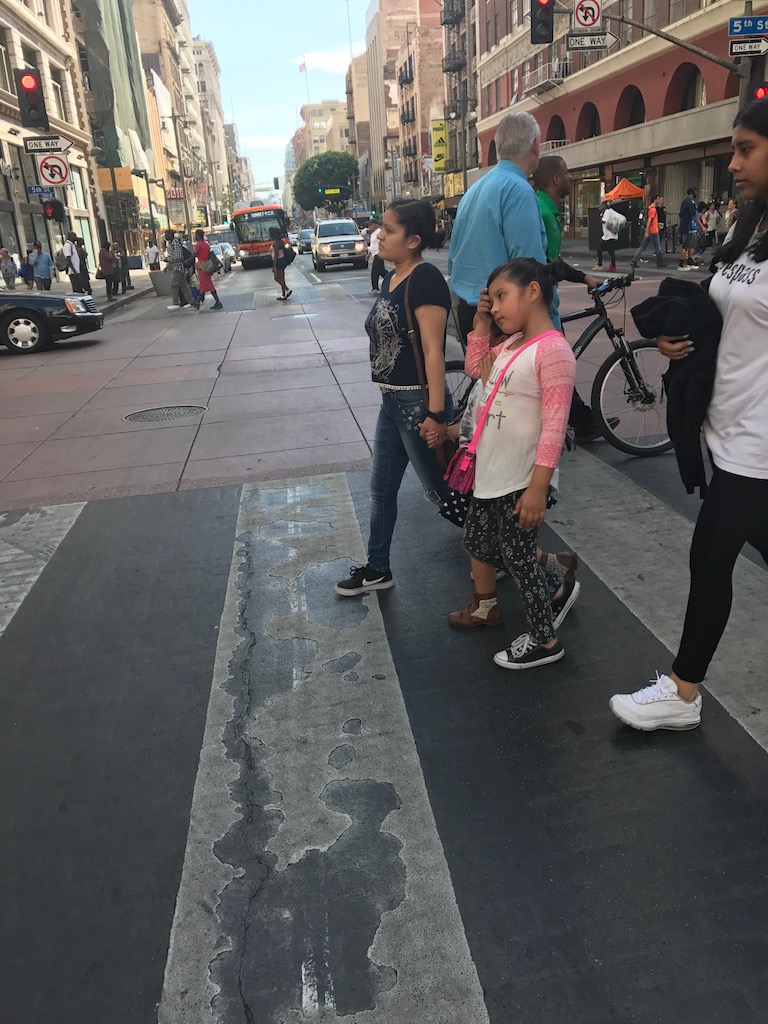
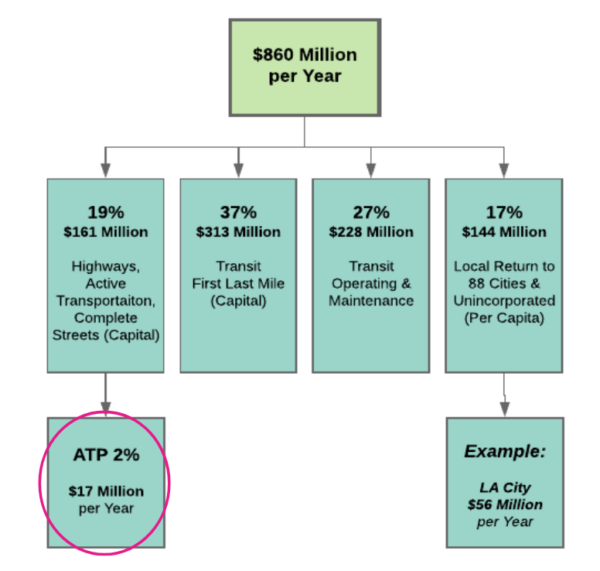
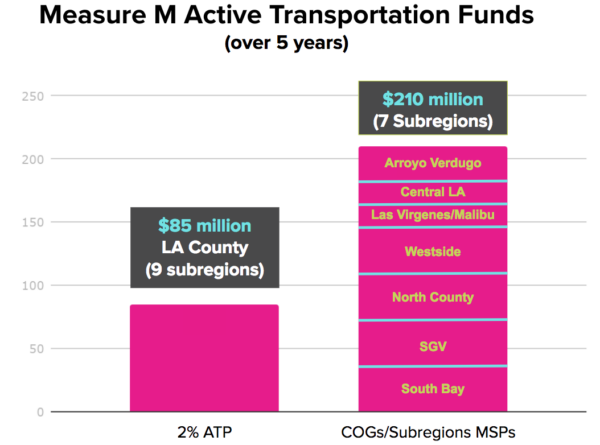
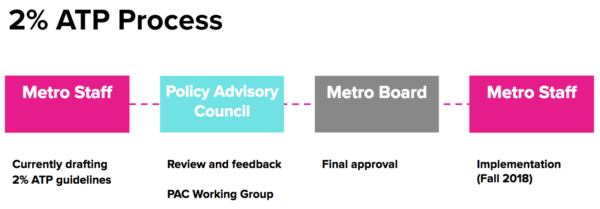
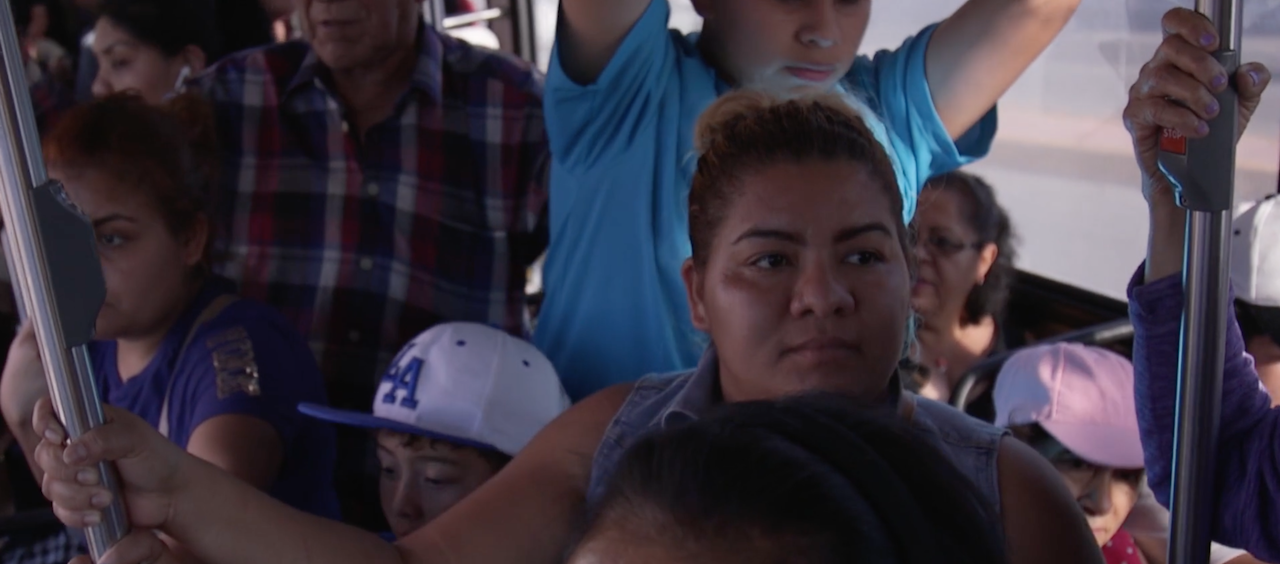

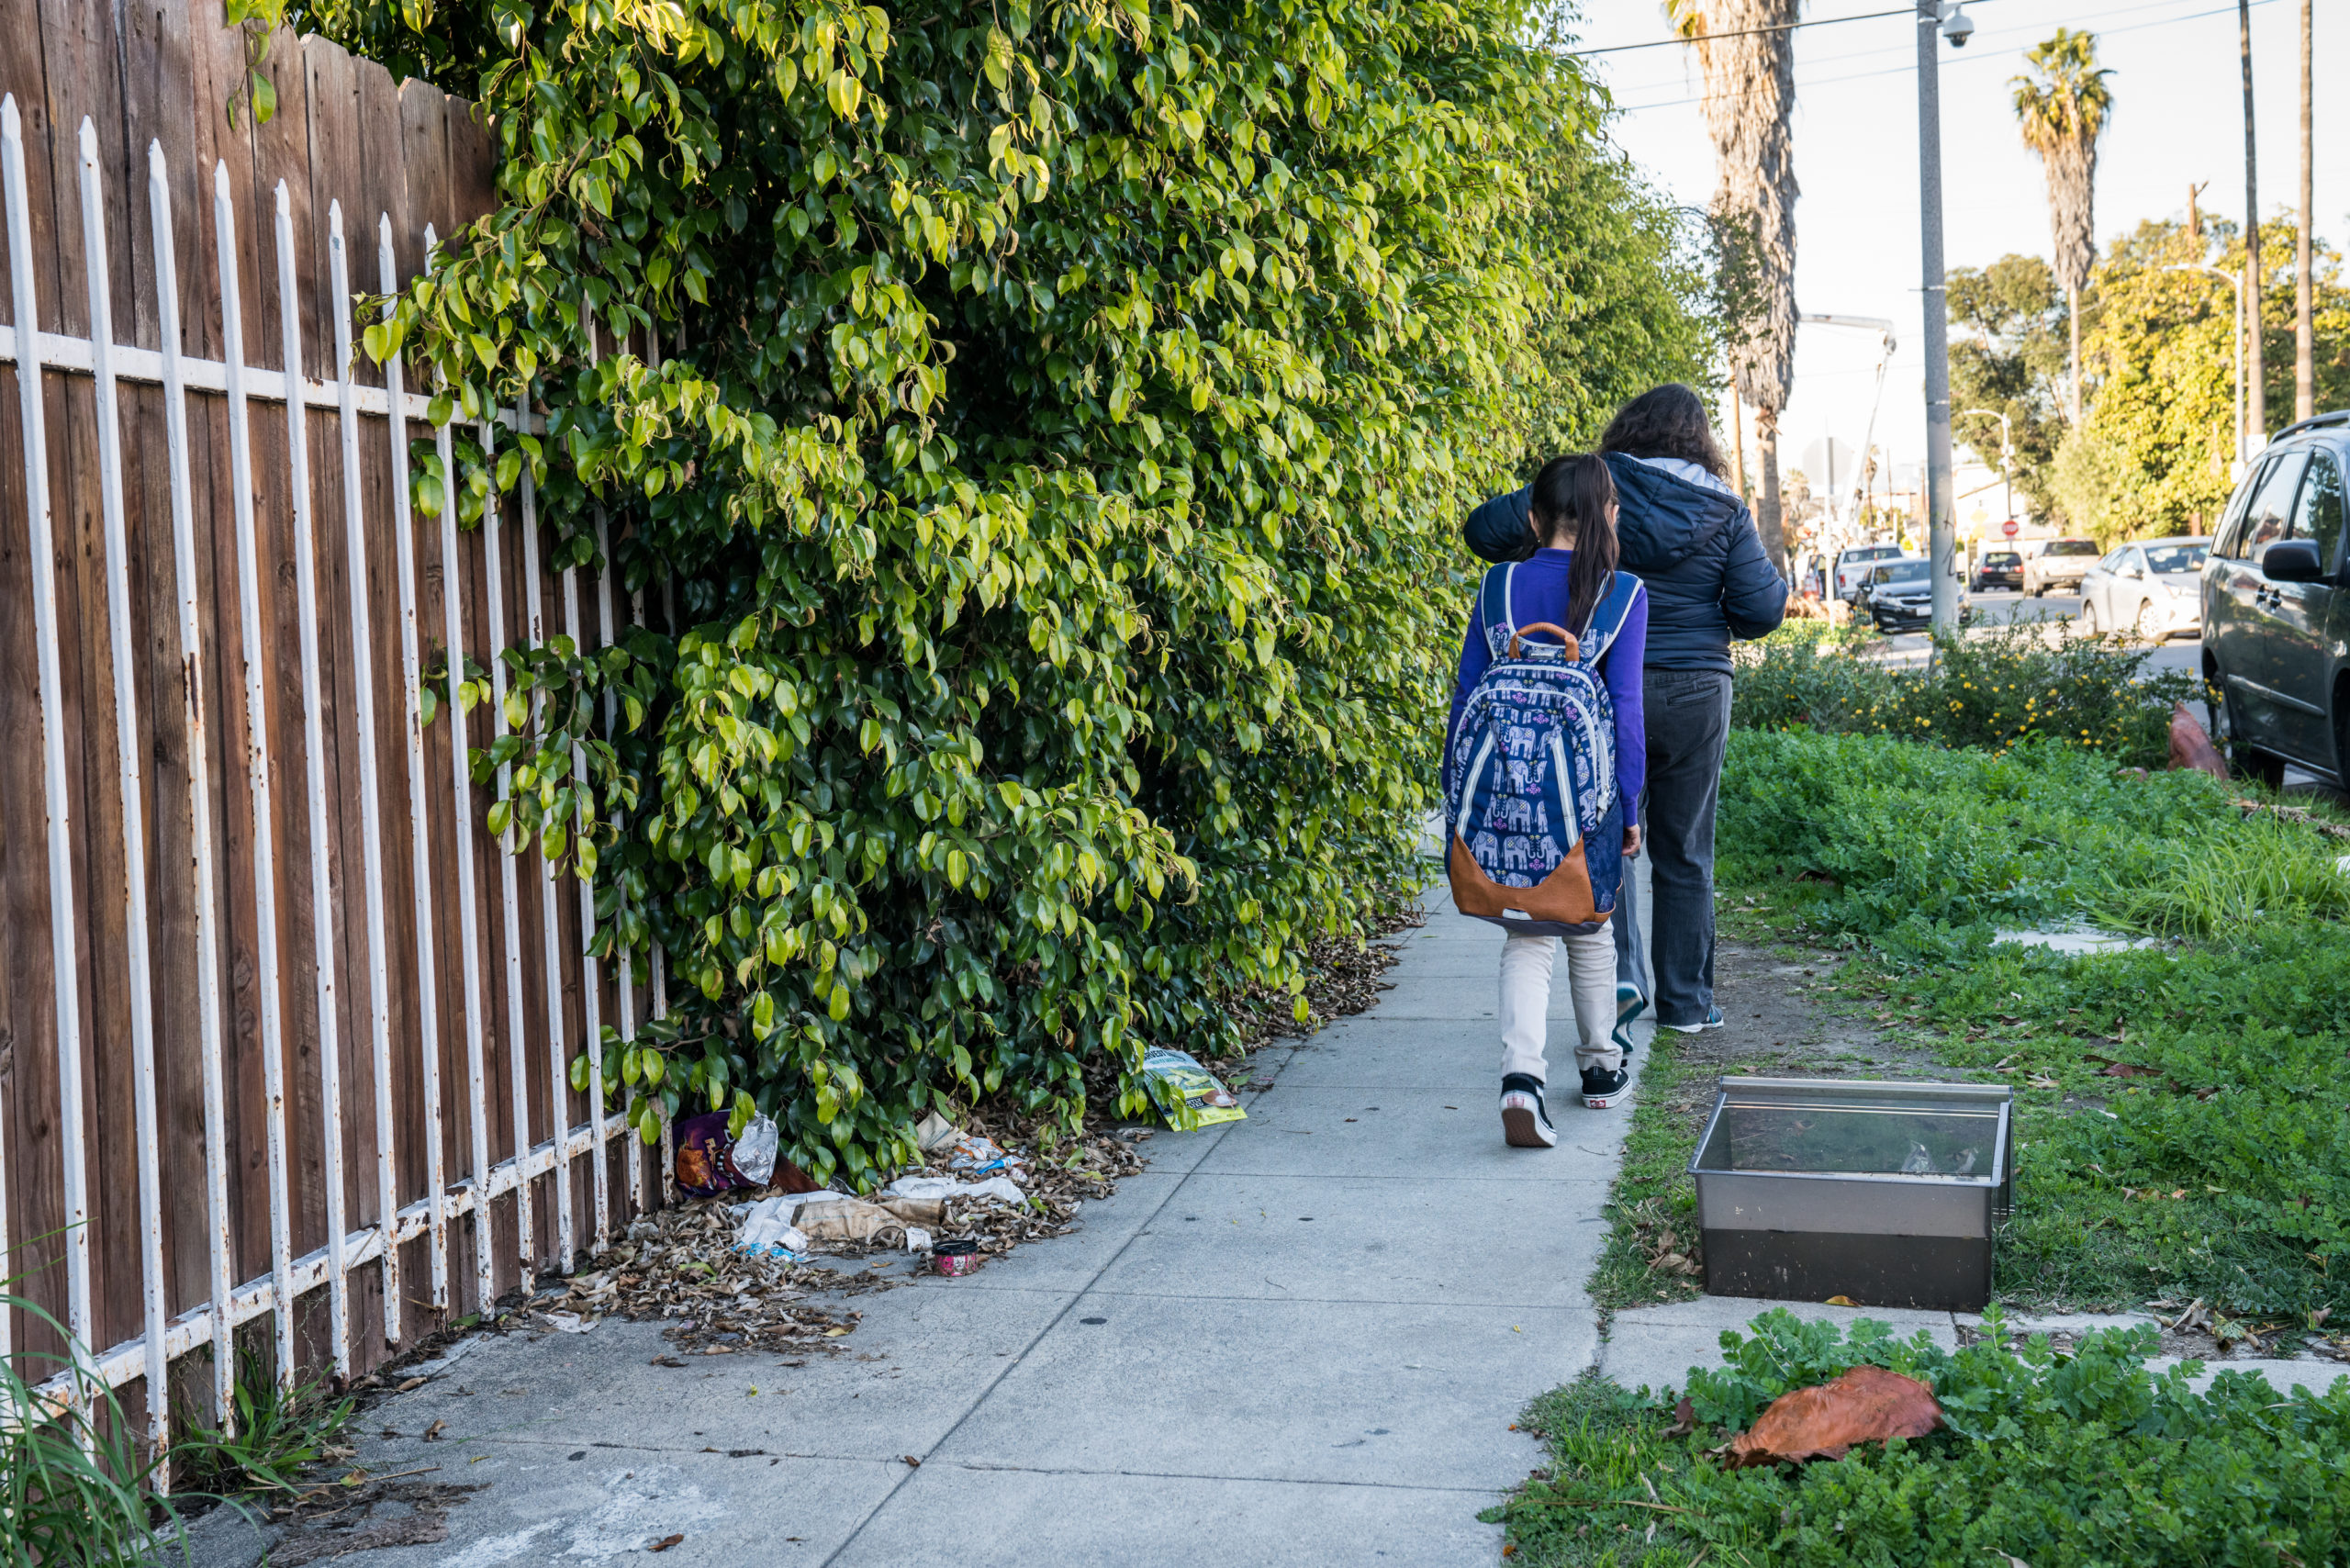

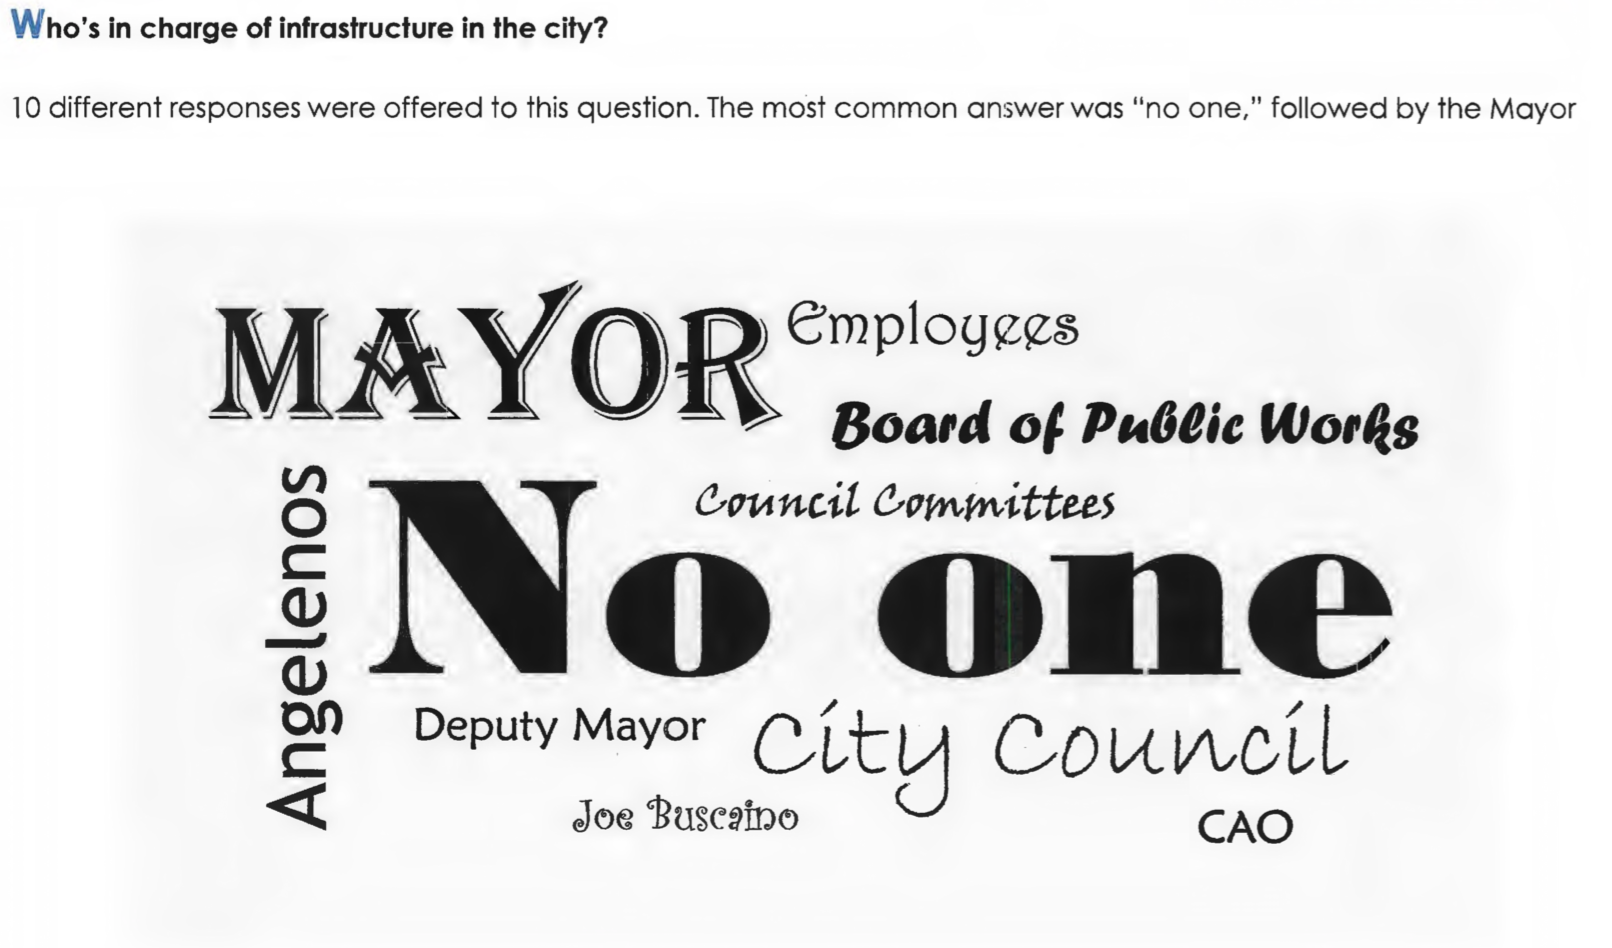


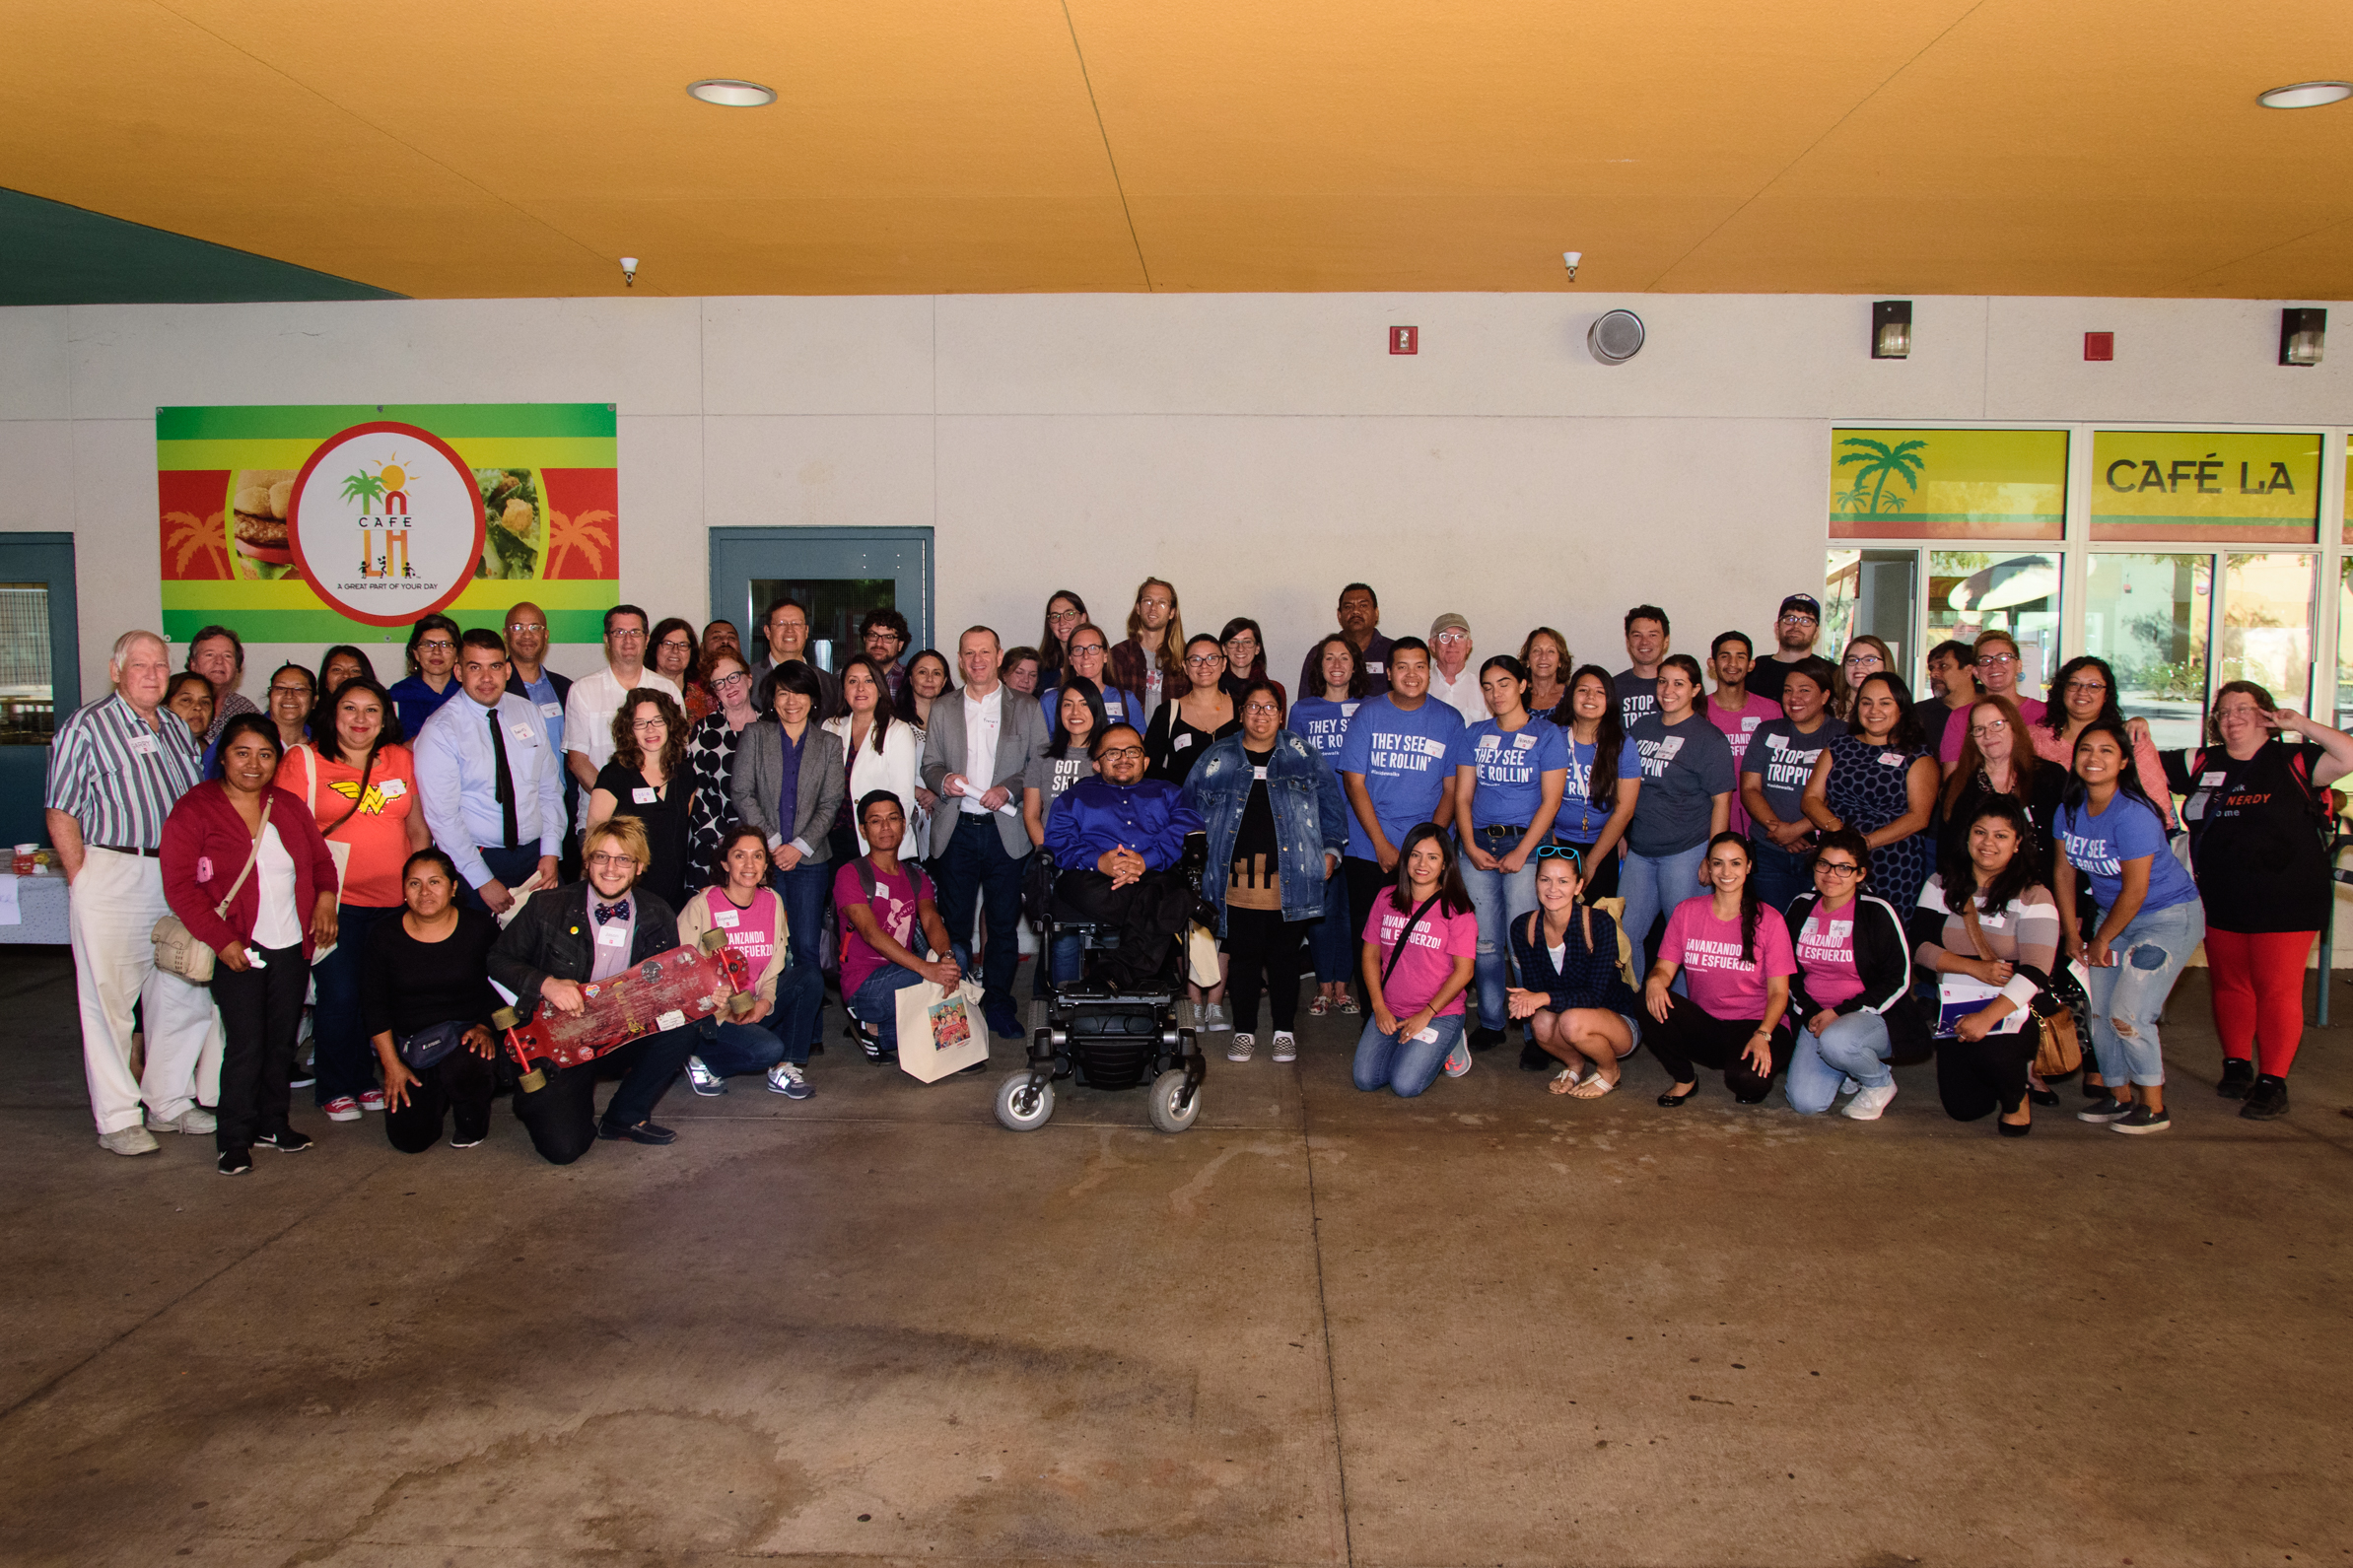
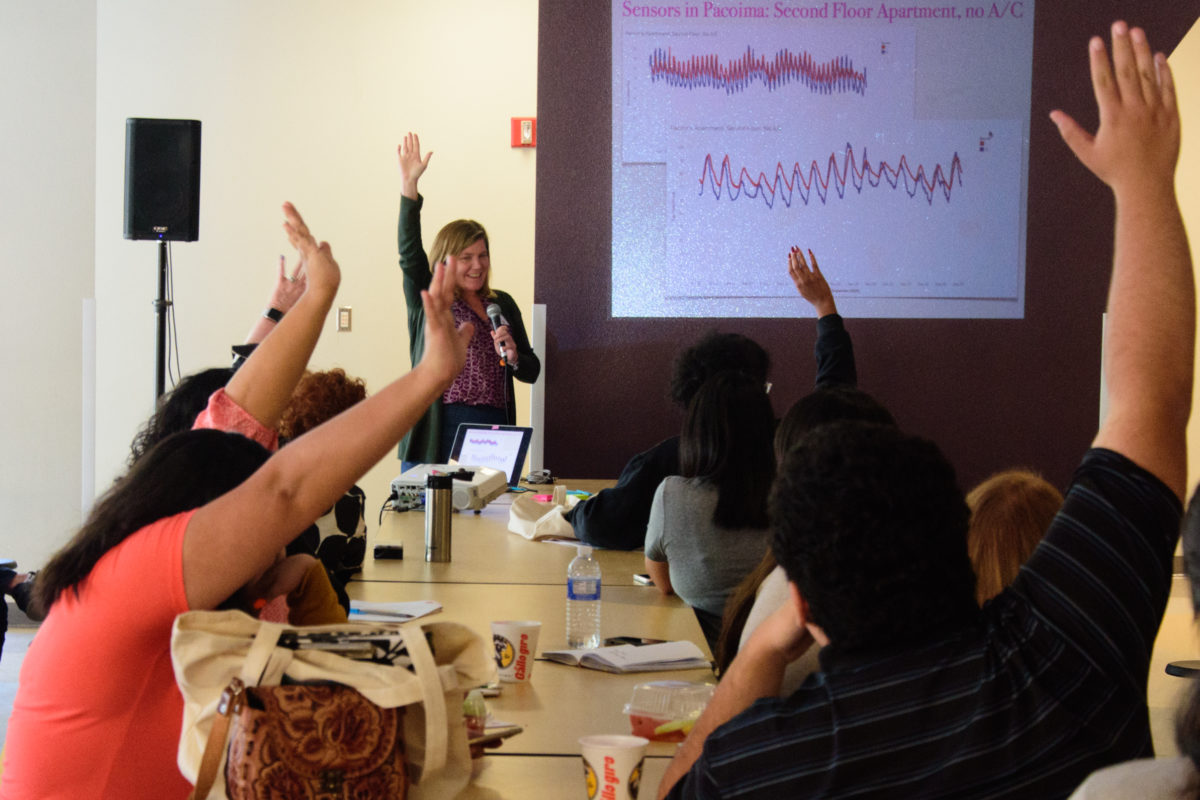


You must be logged in to post a comment.